SPECpower_ssj2008
Host 'WIN-SUT112' Performance Report
Copyright © 2007-2019 Standard Performance Evaluation Corporation
| New H3C Technologies Co., Ltd. H3C UniServer B5700 G3 | ssj_ops@100% = 5,715,288 ssj_ops@100% per JVM = 1,428,822 |
||||
| Test Sponsor: | New H3C Technologies Co., Ltd. | SPEC License #: | 9066 | Test Method: | Multi Node |
| Tested By: | New H3C Technologies Co., Ltd. | Test Location: | Hangzhou, Zhejiang, China | Test Date: | May 23, 2019 |
| Hardware Availability: | Jan-2019 | Software Availability: | Jan-2019 | Publication: | Jun 26, 2019 |
| System Source: | Single Supplier | System Designation: | Server | Power Provisioning: | Line-powered |
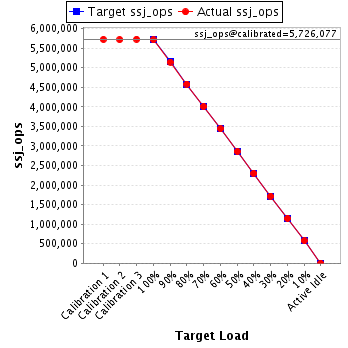
| Target Load | Actual Load | ssj_ops | |
|---|---|---|---|
| Target | Actual | ||
| Calibration 1 | 5,726,264 | ||
| Calibration 2 | 5,719,672 | ||
| Calibration 3 | 5,732,483 | ||
| ssj_ops@calibrated=5,726,077 | |||
| 100% | 99.8% | 5,726,077 | 5,715,288 |
| 90% | 89.9% | 5,153,470 | 5,146,851 |
| 80% | 80.1% | 4,580,862 | 4,584,358 |
| 70% | 70.1% | 4,008,254 | 4,012,315 |
| 60% | 60.1% | 3,435,646 | 3,438,758 |
| 50% | 50.0% | 2,863,039 | 2,861,320 |
| 40% | 40.1% | 2,290,431 | 2,298,059 |
| 30% | 30.0% | 1,717,823 | 1,719,796 |
| 20% | 20.1% | 1,145,215 | 1,148,379 |
| 10% | 10.0% | 572,608 | 575,355 |
| Active Idle | 0 | 0 | |
| Set Identifier: | sut |
| Set Description: | System Under Test |
| # of Identical Nodes: | 15 |
| Comment: | SUT |
| Hardware | |
|---|---|
| Hardware Vendor: | New H3C Technologies Co., Ltd. |
| Model: | H3C UniServer B5700 G3 |
| Form Factor: | other |
| CPU Name: | Intel Xeon Platinum 8180 2.50GHz |
| CPU Characteristics: | 28-Core, 2.50 GHz, 38.5 MB L3 Cache |
| CPU Frequency (MHz): | 2500 |
| CPU(s) Enabled: | 56 cores, 2 chips, 28 cores/chip |
| Hardware Threads: | 112 (2 / core) |
| CPU(s) Orderable: | 1,2 chips |
| Primary Cache: | 32 KB I + 32 KB D on chip per core |
| Secondary Cache: | 1 MB I+D on chip per core |
| Tertiary Cache: | 39424 KB I+D on chip per chip |
| Other Cache: | None |
| Memory Amount (GB): | 192.0 |
| # and size of DIMM: | 12 x 16384 MB |
| Memory Details: | 12 x 16GB 2Rx8 PC4-2666-V ECC;slots A1, A2, A3, A4, A5, A6, B1, B2, B3, B4, B5, B6 populated |
| Power Supply Quantity and Rating (W): | None |
| Power Supply Details: | Shared |
| Disk Drive: | SATA DOM 128GB P/N DESSH-A28D09BCADCA |
| Disk Controller: | Integrated SATA controller |
| # and type of Network Interface Cards (NICs) Installed: | 1 x Intel I350 Gigabit Ethernet Controller |
| NICs Enabled in Firmware / OS / Connected: | 2/2/1 |
| Network Speed (Mbit): | 1000 |
| Keyboard: | None |
| Mouse: | None |
| Monitor: | None |
| Optical Drives: | No |
| Other Hardware: | None |
| Software | |
|---|---|
| Power Management: | Balanced Mode enabled in OS (see SUT Notes) |
| Operating System (OS): | Microsoft Windows Server 2012 R2 Datacenter |
| OS Version: | Version 6.3 (Build 9600) |
| Filesystem: | NTFS |
| JVM Vendor: | Oracle Corporation |
| JVM Version: | Java HotSpot(TM) 64-Bit Server VM (build 24.80-b11, mixed mode), version 1.7.0_80 |
| JVM Command-line Options: | -server -Xmn19g -Xms21g -Xmx21g -XX:SurvivorRatio=1 -XX:TargetSurvivorRatio=99 -XX:ParallelGCThreads=28 -XX:AllocatePrefetchDistance=256 -XX:AllocatePrefetchLines=4 -XX:LoopUnrollLimit=45 -XX:InitialTenuringThreshold=12 -XX:MaxTenuringThreshold=15 -XX:InlineSmallCode=9000 -XX:MaxInlineSize=270 -XX:FreqInlineSize=6000 -XX:+UseLargePages -XX:+UseParallelOldGC -XX:+AggressiveOpts |
| JVM Affinity: | start /NODE [0,2] /AFFINITY [0xFC0FF00FC0FF];start /NODE [1,3] /AFFINITY [0xFF03F00FF03F] |
| JVM Instances: | 4 |
| JVM Initial Heap (MB): | 21000 |
| JVM Maximum Heap (MB): | 21000 |
| JVM Address Bits: | 64 |
| Boot Firmware Version: | 2.00.25 |
| Management Firmware Version: | UIS-OM 1.00.10 |
| Workload Version: | SSJ 1.2.10 |
| Director Location: | Controller |
| Other Software: | Microsoft Windows KB3021910, clearcompressionflag.exe, KB2919355, KB2932046, KB2959977, KB2937592, KB2938439, KB2934018, KB4056898, patched to this test system in May 16, 2019 |
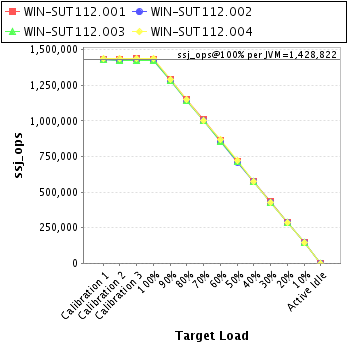
| JVM Instance | ssj_ops@100% |
|---|---|
| WIN-SUT112.001 | 1,429,050 |
| WIN-SUT112.002 | 1,425,620 |
| WIN-SUT112.003 | 1,423,139 |
| WIN-SUT112.004 | 1,437,479 |
| ssj_ops@100% | 5,715,288 |
| ssj_ops@100% per JVM | 1,428,822 |
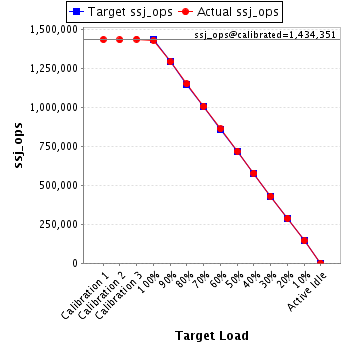
| Target Load | Actual Load | ssj_ops | |
|---|---|---|---|
| Target | Actual | ||
| Calibration 1 | 1,433,366 | ||
| Calibration 2 | 1,432,039 | ||
| Calibration 3 | 1,436,663 | ||
| ssj_ops@calibrated=1,434,351 | |||
| 100% | 99.6% | 1,434,351 | 1,429,050 |
| 90% | 90.0% | 1,290,916 | 1,291,551 |
| 80% | 80.2% | 1,147,481 | 1,149,741 |
| 70% | 70.2% | 1,004,046 | 1,006,506 |
| 60% | 60.0% | 860,610 | 860,967 |
| 50% | 50.0% | 717,175 | 717,797 |
| 40% | 40.2% | 573,740 | 577,283 |
| 30% | 30.0% | 430,305 | 430,747 |
| 20% | 20.1% | 286,870 | 288,653 |
| 10% | 10.1% | 143,435 | 144,808 |
| Active Idle | 0 | 0 | |
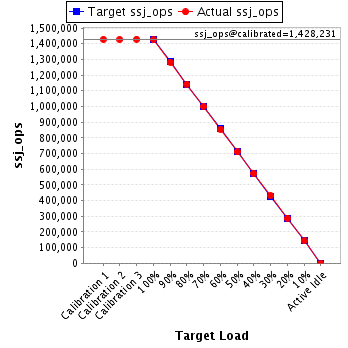
| Target Load | Actual Load | ssj_ops | |
|---|---|---|---|
| Target | Actual | ||
| Calibration 1 | 1,427,858 | ||
| Calibration 2 | 1,427,099 | ||
| Calibration 3 | 1,429,364 | ||
| ssj_ops@calibrated=1,428,231 | |||
| 100% | 99.8% | 1,428,231 | 1,425,620 |
| 90% | 89.9% | 1,285,408 | 1,283,359 |
| 80% | 80.0% | 1,142,585 | 1,143,089 |
| 70% | 70.0% | 999,762 | 1,000,085 |
| 60% | 59.9% | 856,939 | 856,208 |
| 50% | 49.7% | 714,116 | 710,279 |
| 40% | 40.1% | 571,293 | 572,466 |
| 30% | 30.1% | 428,469 | 429,939 |
| 20% | 20.1% | 285,646 | 287,421 |
| 10% | 10.0% | 142,823 | 143,167 |
| Active Idle | 0 | 0 | |
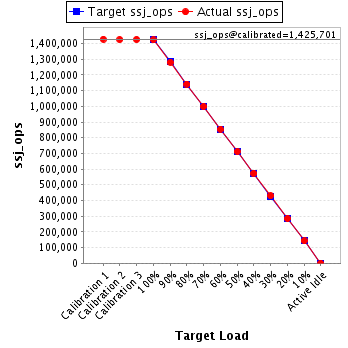
| Target Load | Actual Load | ssj_ops | |
|---|---|---|---|
| Target | Actual | ||
| Calibration 1 | 1,428,181 | ||
| Calibration 2 | 1,425,496 | ||
| Calibration 3 | 1,425,907 | ||
| ssj_ops@calibrated=1,425,701 | |||
| 100% | 99.8% | 1,425,701 | 1,423,139 |
| 90% | 89.8% | 1,283,131 | 1,280,836 |
| 80% | 80.1% | 1,140,561 | 1,142,117 |
| 70% | 70.1% | 997,991 | 1,000,120 |
| 60% | 60.0% | 855,421 | 855,409 |
| 50% | 49.9% | 712,851 | 711,636 |
| 40% | 40.2% | 570,280 | 572,477 |
| 30% | 30.1% | 427,710 | 429,162 |
| 20% | 20.0% | 285,140 | 284,720 |
| 10% | 10.0% | 142,570 | 142,458 |
| Active Idle | 0 | 0 | |
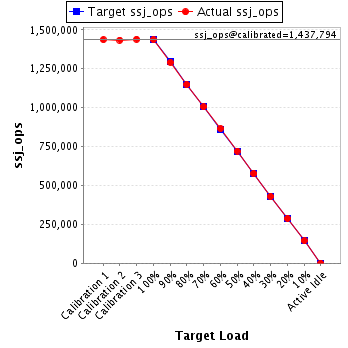
| Target Load | Actual Load | ssj_ops | |
|---|---|---|---|
| Target | Actual | ||
| Calibration 1 | 1,436,860 | ||
| Calibration 2 | 1,435,038 | ||
| Calibration 3 | 1,440,550 | ||
| ssj_ops@calibrated=1,437,794 | |||
| 100% | 100.0% | 1,437,794 | 1,437,479 |
| 90% | 89.8% | 1,294,015 | 1,291,105 |
| 80% | 79.9% | 1,150,235 | 1,149,412 |
| 70% | 69.9% | 1,006,456 | 1,005,604 |
| 60% | 60.2% | 862,676 | 866,174 |
| 50% | 50.2% | 718,897 | 721,608 |
| 40% | 40.0% | 575,118 | 575,832 |
| 30% | 29.9% | 431,338 | 429,949 |
| 20% | 20.0% | 287,559 | 287,585 |
| 10% | 10.1% | 143,779 | 144,922 |
| Active Idle | 0 | 0 | |