SPECpower_ssj2008
Host 'WIN-SUT111' Performance Report
Copyright © 2007-2019 Standard Performance Evaluation Corporation
| New H3C Technologies Co., Ltd. H3C UniServer B5700 G3 | ssj_ops@100% = 5,702,235 ssj_ops@100% per JVM = 1,425,559 |
||||
| Test Sponsor: | New H3C Technologies Co., Ltd. | SPEC License #: | 9066 | Test Method: | Multi Node |
| Tested By: | New H3C Technologies Co., Ltd. | Test Location: | Hangzhou, Zhejiang, China | Test Date: | May 23, 2019 |
| Hardware Availability: | Jan-2019 | Software Availability: | Jan-2019 | Publication: | Jun 26, 2019 |
| System Source: | Single Supplier | System Designation: | Server | Power Provisioning: | Line-powered |
| Target Load | Actual Load | ssj_ops | |
|---|---|---|---|
| Target | Actual | ||
| Calibration 1 | 5,709,376 | ||
| Calibration 2 | 5,706,071 | ||
| Calibration 3 | 5,715,041 | ||
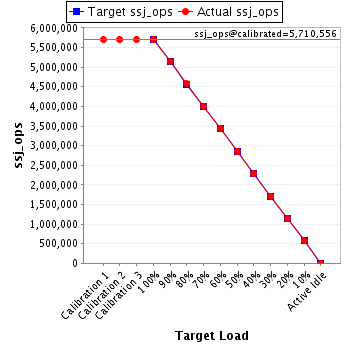
| ssj_ops@calibrated=5,710,556 | |||
| 100% | 99.9% | 5,710,556 | 5,702,235 |
| 90% | 90.0% | 5,139,500 | 5,140,570 |
| 80% | 80.1% | 4,568,445 | 4,572,910 |
| 70% | 70.0% | 3,997,389 | 3,997,814 |
| 60% | 60.0% | 3,426,334 | 3,427,694 |
| 50% | 50.0% | 2,855,278 | 2,857,549 |
| 40% | 40.0% | 2,284,222 | 2,282,537 |
| 30% | 30.0% | 1,713,167 | 1,715,083 |
| 20% | 20.0% | 1,142,111 | 1,140,480 |
| 10% | 10.0% | 571,056 | 569,560 |
| Active Idle | 0 | 0 | |
| Set Identifier: | sut |
| Set Description: | System Under Test |
| # of Identical Nodes: | 15 |
| Comment: | SUT |
| Hardware | |
|---|---|
| Hardware Vendor: | New H3C Technologies Co., Ltd. |
| Model: | H3C UniServer B5700 G3 |
| Form Factor: | other |
| CPU Name: | Intel Xeon Platinum 8180 2.50GHz |
| CPU Characteristics: | 28-Core, 2.50 GHz, 38.5 MB L3 Cache |
| CPU Frequency (MHz): | 2500 |
| CPU(s) Enabled: | 56 cores, 2 chips, 28 cores/chip |
| Hardware Threads: | 112 (2 / core) |
| CPU(s) Orderable: | 1,2 chips |
| Primary Cache: | 32 KB I + 32 KB D on chip per core |
| Secondary Cache: | 1 MB I+D on chip per core |
| Tertiary Cache: | 39424 KB I+D on chip per chip |
| Other Cache: | None |
| Memory Amount (GB): | 192.0 |
| # and size of DIMM: | 12 x 16384 MB |
| Memory Details: | 12 x 16GB 2Rx8 PC4-2666-V ECC;slots A1, A2, A3, A4, A5, A6, B1, B2, B3, B4, B5, B6 populated |
| Power Supply Quantity and Rating (W): | None |
| Power Supply Details: | Shared |
| Disk Drive: | SATA DOM 128GB P/N DESSH-A28D09BCADCA |
| Disk Controller: | Integrated SATA controller |
| # and type of Network Interface Cards (NICs) Installed: | 1 x Intel I350 Gigabit Ethernet Controller |
| NICs Enabled in Firmware / OS / Connected: | 2/2/1 |
| Network Speed (Mbit): | 1000 |
| Keyboard: | None |
| Mouse: | None |
| Monitor: | None |
| Optical Drives: | No |
| Other Hardware: | None |
| Software | |
|---|---|
| Power Management: | Balanced Mode enabled in OS (see SUT Notes) |
| Operating System (OS): | Microsoft Windows Server 2012 R2 Datacenter |
| OS Version: | Version 6.3 (Build 9600) |
| Filesystem: | NTFS |
| JVM Vendor: | Oracle Corporation |
| JVM Version: | Java HotSpot(TM) 64-Bit Server VM (build 24.80-b11, mixed mode), version 1.7.0_80 |
| JVM Command-line Options: | -server -Xmn19g -Xms21g -Xmx21g -XX:SurvivorRatio=1 -XX:TargetSurvivorRatio=99 -XX:ParallelGCThreads=28 -XX:AllocatePrefetchDistance=256 -XX:AllocatePrefetchLines=4 -XX:LoopUnrollLimit=45 -XX:InitialTenuringThreshold=12 -XX:MaxTenuringThreshold=15 -XX:InlineSmallCode=9000 -XX:MaxInlineSize=270 -XX:FreqInlineSize=6000 -XX:+UseLargePages -XX:+UseParallelOldGC -XX:+AggressiveOpts |
| JVM Affinity: | start /NODE [0,2] /AFFINITY [0xFC0FF00FC0FF];start /NODE [1,3] /AFFINITY [0xFF03F00FF03F] |
| JVM Instances: | 4 |
| JVM Initial Heap (MB): | 21000 |
| JVM Maximum Heap (MB): | 21000 |
| JVM Address Bits: | 64 |
| Boot Firmware Version: | 2.00.25 |
| Management Firmware Version: | UIS-OM 1.00.10 |
| Workload Version: | SSJ 1.2.10 |
| Director Location: | Controller |
| Other Software: | Microsoft Windows KB3021910, clearcompressionflag.exe, KB2919355, KB2932046, KB2959977, KB2937592, KB2938439, KB2934018, KB4056898, patched to this test system in May 16, 2019 |
| JVM Instance | ssj_ops@100% |
|---|---|
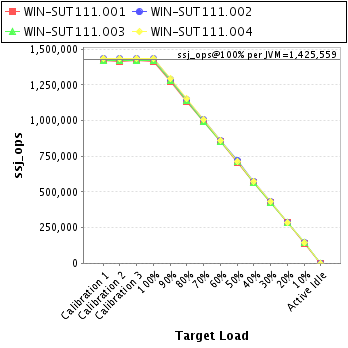
| WIN-SUT111.001 | 1,415,911 |
| WIN-SUT111.002 | 1,432,146 |
| WIN-SUT111.003 | 1,420,656 |
| WIN-SUT111.004 | 1,433,522 |
| ssj_ops@100% | 5,702,235 |
| ssj_ops@100% per JVM | 1,425,559 |
| Target Load | Actual Load | ssj_ops | |
|---|---|---|---|
| Target | Actual | ||
| Calibration 1 | 1,417,541 | ||
| Calibration 2 | 1,415,556 | ||
| Calibration 3 | 1,419,332 | ||
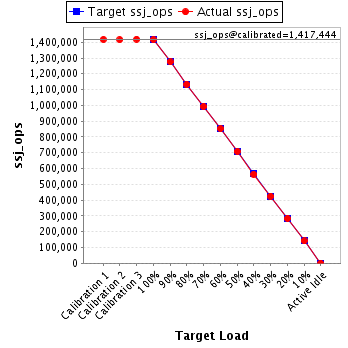
| ssj_ops@calibrated=1,417,444 | |||
| 100% | 99.9% | 1,417,444 | 1,415,911 |
| 90% | 90.0% | 1,275,700 | 1,275,290 |
| 80% | 79.9% | 1,133,955 | 1,132,825 |
| 70% | 70.1% | 992,211 | 993,278 |
| 60% | 60.1% | 850,466 | 851,787 |
| 50% | 50.0% | 708,722 | 708,312 |
| 40% | 39.8% | 566,978 | 564,120 |
| 30% | 30.0% | 425,233 | 425,558 |
| 20% | 20.0% | 283,489 | 283,409 |
| 10% | 10.0% | 141,744 | 141,383 |
| Active Idle | 0 | 0 | |
| Target Load | Actual Load | ssj_ops | |
|---|---|---|---|
| Target | Actual | ||
| Calibration 1 | 1,435,657 | ||
| Calibration 2 | 1,434,677 | ||
| Calibration 3 | 1,435,283 | ||
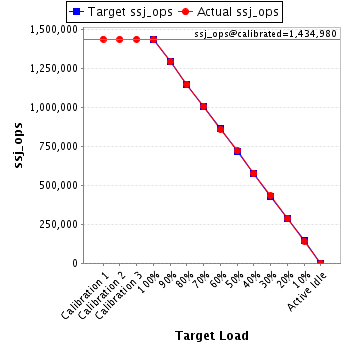
| ssj_ops@calibrated=1,434,980 | |||
| 100% | 99.8% | 1,434,980 | 1,432,146 |
| 90% | 89.9% | 1,291,482 | 1,290,338 |
| 80% | 79.9% | 1,147,984 | 1,146,911 |
| 70% | 70.0% | 1,004,486 | 1,004,566 |
| 60% | 59.9% | 860,988 | 859,953 |
| 50% | 50.2% | 717,490 | 719,846 |
| 40% | 40.1% | 573,992 | 575,505 |
| 30% | 30.1% | 430,494 | 431,488 |
| 20% | 20.0% | 286,996 | 287,607 |
| 10% | 9.9% | 143,498 | 142,517 |
| Active Idle | 0 | 0 | |
| Target Load | Actual Load | ssj_ops | |
|---|---|---|---|
| Target | Actual | ||
| Calibration 1 | 1,420,206 | ||
| Calibration 2 | 1,421,578 | ||
| Calibration 3 | 1,423,332 | ||
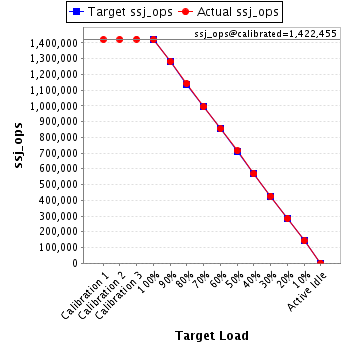
| ssj_ops@calibrated=1,422,455 | |||
| 100% | 99.9% | 1,422,455 | 1,420,656 |
| 90% | 90.1% | 1,280,209 | 1,281,720 |
| 80% | 80.3% | 1,137,964 | 1,141,862 |
| 70% | 69.9% | 995,718 | 993,948 |
| 60% | 60.0% | 853,473 | 854,161 |
| 50% | 50.2% | 711,227 | 713,471 |
| 40% | 39.9% | 568,982 | 567,594 |
| 30% | 30.0% | 426,736 | 426,833 |
| 20% | 20.0% | 284,491 | 284,378 |
| 10% | 10.0% | 142,245 | 142,885 |
| Active Idle | 0 | 0 | |
| Target Load | Actual Load | ssj_ops | |
|---|---|---|---|
| Target | Actual | ||
| Calibration 1 | 1,435,971 | ||
| Calibration 2 | 1,434,260 | ||
| Calibration 3 | 1,437,095 | ||
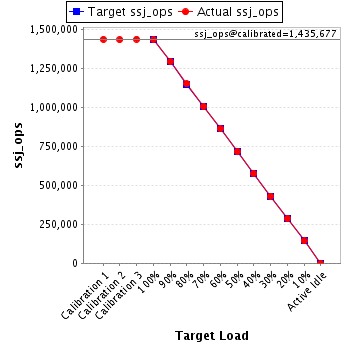
| ssj_ops@calibrated=1,435,677 | |||
| 100% | 99.8% | 1,435,677 | 1,433,522 |
| 90% | 90.1% | 1,292,110 | 1,293,222 |
| 80% | 80.2% | 1,148,542 | 1,151,312 |
| 70% | 70.1% | 1,004,974 | 1,006,022 |
| 60% | 60.0% | 861,406 | 861,792 |
| 50% | 49.9% | 717,839 | 715,921 |
| 40% | 40.1% | 574,271 | 575,317 |
| 30% | 30.0% | 430,703 | 431,204 |
| 20% | 19.9% | 287,135 | 285,086 |
| 10% | 9.9% | 143,568 | 142,775 |
| Active Idle | 0 | 0 | |