SPECpower_ssj2008
Host 'WIN-SUT111' Performance Report
Copyright © 2007-2019 Standard Performance Evaluation Corporation
| New H3C Technologies Co., Ltd. H3C UniServer B5700 G3 | ssj_ops@100% = 5,702,044 ssj_ops@100% per JVM = 1,425,511 |
||||
| Test Sponsor: | New H3C Technologies Co., Ltd. | SPEC License #: | 9066 | Test Method: | Multi Node |
| Tested By: | New H3C Technologies Co., Ltd. | Test Location: | Hangzhou, Zhejiang, China | Test Date: | May 17, 2019 |
| Hardware Availability: | Jan-2019 | Software Availability: | Jan-2019 | Publication: | Jun 12, 2019 |
| System Source: | Single Supplier | System Designation: | Server | Power Provisioning: | Line-powered |
| Target Load | Actual Load | ssj_ops | |
|---|---|---|---|
| Target | Actual | ||
| Calibration 1 | 5,699,686 | ||
| Calibration 2 | 5,699,396 | ||
| Calibration 3 | 5,711,365 | ||
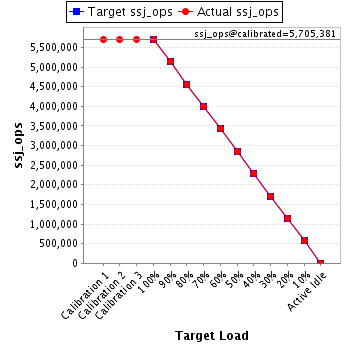
| ssj_ops@calibrated=5,705,381 | |||
| 100% | 99.9% | 5,705,381 | 5,702,044 |
| 90% | 90.0% | 5,134,842 | 5,137,181 |
| 80% | 79.7% | 4,564,304 | 4,548,233 |
| 70% | 70.0% | 3,993,766 | 3,991,423 |
| 60% | 60.1% | 3,423,228 | 3,427,068 |
| 50% | 49.9% | 2,852,690 | 2,848,134 |
| 40% | 40.1% | 2,282,152 | 2,286,903 |
| 30% | 30.0% | 1,711,614 | 1,710,292 |
| 20% | 20.0% | 1,141,076 | 1,142,382 |
| 10% | 10.0% | 570,538 | 570,510 |
| Active Idle | 0 | 0 | |
| Set Identifier: | sut |
| Set Description: | System Under Test |
| # of Identical Nodes: | 13 |
| Comment: | SUT |
| Hardware | |
|---|---|
| Hardware Vendor: | New H3C Technologies Co., Ltd. |
| Model: | H3C UniServer B5700 G3 |
| Form Factor: | Other |
| CPU Name: | Intel Xeon Platinum 8180 2.50GHz |
| CPU Characteristics: | 28-Core, 2.50 GHz, 38.5 MB L3 Cache |
| CPU Frequency (MHz): | 2500 |
| CPU(s) Enabled: | 56 cores, 2 chips, 28 cores/chip |
| Hardware Threads: | 112 (2 / core) |
| CPU(s) Orderable: | 1,2 chips |
| Primary Cache: | 32 KB I + 32 KB D on chip per core |
| Secondary Cache: | 1 MB I+D on chip per core |
| Tertiary Cache: | 39424 KB I+D on chip per chip |
| Other Cache: | None |
| Memory Amount (GB): | 192.0 |
| # and size of DIMM: | 12 x 16384 MB |
| Memory Details: | 12 x 16GB 2Rx8 PC4-2666-V ECC;slots A1, A2, A3, A4, A5, A6, B1, B2, B3, B4, B5, B6 populated |
| Power Supply Quantity and Rating (W): | None |
| Power Supply Details: | Shared |
| Disk Drive: | SATA DOM 128GB P/N DESSH-A28D09BCADCA |
| Disk Controller: | Integrated SATA controller |
| # and type of Network Interface Cards (NICs) Installed: | 1 x Intel I350 Gigabit Ethernet Controller |
| NICs Enabled in Firmware / OS / Connected: | 2/2/1 |
| Network Speed (Mbit): | 1000 |
| Keyboard: | None |
| Mouse: | None |
| Monitor: | None |
| Optical Drives: | No |
| Other Hardware: | None |
| Software | |
|---|---|
| Power Management: | Balanced Mode enabled in OS (see SUT Notes) |
| Operating System (OS): | Microsoft Windows Server 2012 R2 Datacenter |
| OS Version: | Version 6.3 (Build 9600) |
| Filesystem: | NTFS |
| JVM Vendor: | Oracle Corporation |
| JVM Version: | Java HotSpot(TM) 64-Bit Server VM (build 24.80-b11, mixed mode), version 1.7.0_80 |
| JVM Command-line Options: | -server -Xmn19g -Xms21g -Xmx21g -XX:SurvivorRatio=1 -XX:TargetSurvivorRatio=99 -XX:ParallelGCThreads=28 -XX:AllocatePrefetchDistance=256 -XX:AllocatePrefetchLines=4 -XX:LoopUnrollLimit=45 -XX:InitialTenuringThreshold=12 -XX:MaxTenuringThreshold=15 -XX:InlineSmallCode=9000 -XX:MaxInlineSize=270 -XX:FreqInlineSize=6000 -XX:+UseLargePages -XX:+UseParallelOldGC -XX:+AggressiveOpts |
| JVM Affinity: | start /NODE [0,2] /AFFINITY [0xFC0FF00FC0FF];start /NODE [1,3] /AFFINITY [0xFF03F00FF03F] |
| JVM Instances: | 4 |
| JVM Initial Heap (MB): | 21000 |
| JVM Maximum Heap (MB): | 21000 |
| JVM Address Bits: | 64 |
| Boot Firmware Version: | 2.00.25 |
| Management Firmware Version: | UIS-OM 1.00.10 |
| Workload Version: | SSJ 1.2.10 |
| Director Location: | Controller |
| Other Software: | Microsoft Windows KB3021910, clearcompressionflag.exe, KB2919355, KB2932046, KB2959977, KB2937592, KB2938439, KB2934018, KB4056898, patched to this test system in May 15, 2019 |
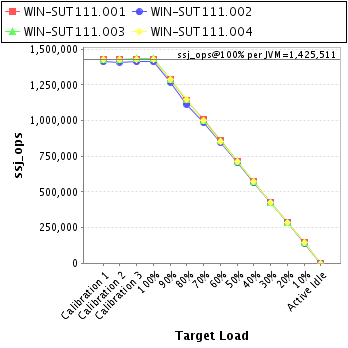
| JVM Instance | ssj_ops@100% |
|---|---|
| WIN-SUT111.001 | 1,429,128 |
| WIN-SUT111.002 | 1,411,327 |
| WIN-SUT111.003 | 1,433,563 |
| WIN-SUT111.004 | 1,428,026 |
| ssj_ops@100% | 5,702,044 |
| ssj_ops@100% per JVM | 1,425,511 |
| Target Load | Actual Load | ssj_ops | |
|---|---|---|---|
| Target | Actual | ||
| Calibration 1 | 1,428,179 | ||
| Calibration 2 | 1,431,165 | ||
| Calibration 3 | 1,430,874 | ||
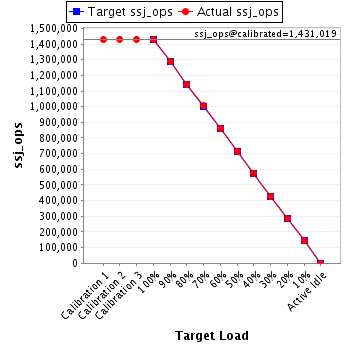
| ssj_ops@calibrated=1,431,019 | |||
| 100% | 99.9% | 1,431,019 | 1,429,128 |
| 90% | 90.2% | 1,287,917 | 1,291,016 |
| 80% | 80.0% | 1,144,816 | 1,144,251 |
| 70% | 70.2% | 1,001,714 | 1,004,470 |
| 60% | 60.3% | 858,612 | 862,531 |
| 50% | 50.0% | 715,510 | 715,113 |
| 40% | 40.3% | 572,408 | 576,283 |
| 30% | 30.0% | 429,306 | 428,884 |
| 20% | 19.9% | 286,204 | 285,296 |
| 10% | 10.0% | 143,102 | 142,747 |
| Active Idle | 0 | 0 | |
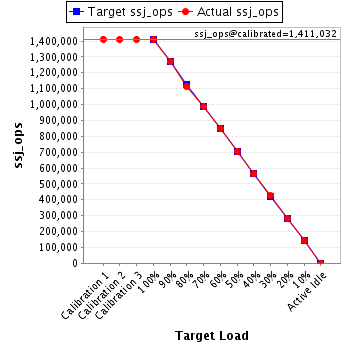
| Target Load | Actual Load | ssj_ops | |
|---|---|---|---|
| Target | Actual | ||
| Calibration 1 | 1,411,779 | ||
| Calibration 2 | 1,410,482 | ||
| Calibration 3 | 1,411,583 | ||
| ssj_ops@calibrated=1,411,032 | |||
| 100% | 100.0% | 1,411,032 | 1,411,327 |
| 90% | 90.0% | 1,269,929 | 1,270,142 |
| 80% | 78.9% | 1,128,826 | 1,113,957 |
| 70% | 69.9% | 987,723 | 986,365 |
| 60% | 60.1% | 846,619 | 847,680 |
| 50% | 49.9% | 705,516 | 704,154 |
| 40% | 39.9% | 564,413 | 562,691 |
| 30% | 30.1% | 423,310 | 424,574 |
| 20% | 20.1% | 282,206 | 283,027 |
| 10% | 10.0% | 141,103 | 141,484 |
| Active Idle | 0 | 0 | |
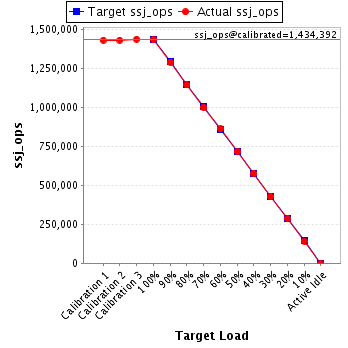
| Target Load | Actual Load | ssj_ops | |
|---|---|---|---|
| Target | Actual | ||
| Calibration 1 | 1,431,275 | ||
| Calibration 2 | 1,431,415 | ||
| Calibration 3 | 1,437,370 | ||
| ssj_ops@calibrated=1,434,392 | |||
| 100% | 99.9% | 1,434,392 | 1,433,563 |
| 90% | 90.0% | 1,290,953 | 1,290,848 |
| 80% | 79.8% | 1,147,514 | 1,144,583 |
| 70% | 69.7% | 1,004,075 | 1,000,483 |
| 60% | 60.1% | 860,635 | 862,508 |
| 50% | 49.9% | 717,196 | 716,056 |
| 40% | 40.2% | 573,757 | 576,417 |
| 30% | 29.8% | 430,318 | 427,973 |
| 20% | 20.0% | 286,878 | 287,244 |
| 10% | 9.9% | 143,439 | 142,692 |
| Active Idle | 0 | 0 | |
| Target Load | Actual Load | ssj_ops | |
|---|---|---|---|
| Target | Actual | ||
| Calibration 1 | 1,428,453 | ||
| Calibration 2 | 1,426,334 | ||
| Calibration 3 | 1,431,538 | ||
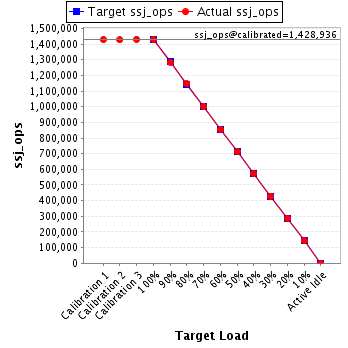
| ssj_ops@calibrated=1,428,936 | |||
| 100% | 99.9% | 1,428,936 | 1,428,026 |
| 90% | 89.9% | 1,286,043 | 1,285,176 |
| 80% | 80.2% | 1,143,149 | 1,145,442 |
| 70% | 70.0% | 1,000,255 | 1,000,104 |
| 60% | 59.8% | 857,362 | 854,349 |
| 50% | 49.9% | 714,468 | 712,811 |
| 40% | 40.0% | 571,574 | 571,512 |
| 30% | 30.0% | 428,681 | 428,861 |
| 20% | 20.1% | 285,787 | 286,815 |
| 10% | 10.0% | 142,894 | 143,586 |
| Active Idle | 0 | 0 | |