SPECpower_ssj2008
Host 'WIN-SUT106' Performance Report
Copyright © 2007-2019 Standard Performance Evaluation Corporation
| New H3C Technologies Co., Ltd. H3C UniServer B5700 G3 | ssj_ops@100% = 5,679,637 ssj_ops@100% per JVM = 1,419,909 |
||||
| Test Sponsor: | New H3C Technologies Co., Ltd. | SPEC License #: | 9066 | Test Method: | Multi Node |
| Tested By: | New H3C Technologies Co., Ltd. | Test Location: | Hangzhou, Zhejiang, China | Test Date: | May 17, 2019 |
| Hardware Availability: | Jan-2019 | Software Availability: | Jan-2019 | Publication: | Jun 12, 2019 |
| System Source: | Single Supplier | System Designation: | Server | Power Provisioning: | Line-powered |
| Target Load | Actual Load | ssj_ops | |
|---|---|---|---|
| Target | Actual | ||
| Calibration 1 | 5,690,370 | ||
| Calibration 2 | 5,687,314 | ||
| Calibration 3 | 5,697,649 | ||
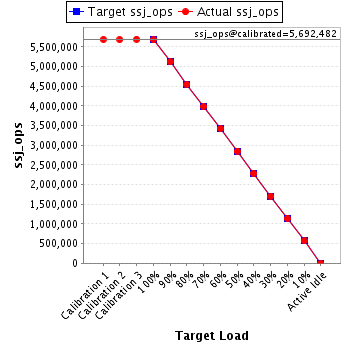
| ssj_ops@calibrated=5,692,482 | |||
| 100% | 99.8% | 5,692,482 | 5,679,637 |
| 90% | 89.9% | 5,123,234 | 5,118,503 |
| 80% | 79.9% | 4,553,986 | 4,549,203 |
| 70% | 70.0% | 3,984,737 | 3,982,344 |
| 60% | 60.0% | 3,415,489 | 3,415,744 |
| 50% | 50.1% | 2,846,241 | 2,850,441 |
| 40% | 40.0% | 2,276,993 | 2,279,538 |
| 30% | 30.0% | 1,707,745 | 1,708,667 |
| 20% | 20.0% | 1,138,496 | 1,136,329 |
| 10% | 10.0% | 569,248 | 570,427 |
| Active Idle | 0 | 0 | |
| Set Identifier: | sut |
| Set Description: | System Under Test |
| # of Identical Nodes: | 13 |
| Comment: | SUT |
| Hardware | |
|---|---|
| Hardware Vendor: | New H3C Technologies Co., Ltd. |
| Model: | H3C UniServer B5700 G3 |
| Form Factor: | Other |
| CPU Name: | Intel Xeon Platinum 8180 2.50GHz |
| CPU Characteristics: | 28-Core, 2.50 GHz, 38.5 MB L3 Cache |
| CPU Frequency (MHz): | 2500 |
| CPU(s) Enabled: | 56 cores, 2 chips, 28 cores/chip |
| Hardware Threads: | 112 (2 / core) |
| CPU(s) Orderable: | 1,2 chips |
| Primary Cache: | 32 KB I + 32 KB D on chip per core |
| Secondary Cache: | 1 MB I+D on chip per core |
| Tertiary Cache: | 39424 KB I+D on chip per chip |
| Other Cache: | None |
| Memory Amount (GB): | 192.0 |
| # and size of DIMM: | 12 x 16384 MB |
| Memory Details: | 12 x 16GB 2Rx8 PC4-2666-V ECC;slots A1, A2, A3, A4, A5, A6, B1, B2, B3, B4, B5, B6 populated |
| Power Supply Quantity and Rating (W): | None |
| Power Supply Details: | Shared |
| Disk Drive: | SATA DOM 128GB P/N DESSH-A28D09BCADCA |
| Disk Controller: | Integrated SATA controller |
| # and type of Network Interface Cards (NICs) Installed: | 1 x Intel I350 Gigabit Ethernet Controller |
| NICs Enabled in Firmware / OS / Connected: | 2/2/1 |
| Network Speed (Mbit): | 1000 |
| Keyboard: | None |
| Mouse: | None |
| Monitor: | None |
| Optical Drives: | No |
| Other Hardware: | None |
| Software | |
|---|---|
| Power Management: | Balanced Mode enabled in OS (see SUT Notes) |
| Operating System (OS): | Microsoft Windows Server 2012 R2 Datacenter |
| OS Version: | Version 6.3 (Build 9600) |
| Filesystem: | NTFS |
| JVM Vendor: | Oracle Corporation |
| JVM Version: | Java HotSpot(TM) 64-Bit Server VM (build 24.80-b11, mixed mode), version 1.7.0_80 |
| JVM Command-line Options: | -server -Xmn19g -Xms21g -Xmx21g -XX:SurvivorRatio=1 -XX:TargetSurvivorRatio=99 -XX:ParallelGCThreads=28 -XX:AllocatePrefetchDistance=256 -XX:AllocatePrefetchLines=4 -XX:LoopUnrollLimit=45 -XX:InitialTenuringThreshold=12 -XX:MaxTenuringThreshold=15 -XX:InlineSmallCode=9000 -XX:MaxInlineSize=270 -XX:FreqInlineSize=6000 -XX:+UseLargePages -XX:+UseParallelOldGC -XX:+AggressiveOpts |
| JVM Affinity: | start /NODE [0,2] /AFFINITY [0xFC0FF00FC0FF];start /NODE [1,3] /AFFINITY [0xFF03F00FF03F] |
| JVM Instances: | 4 |
| JVM Initial Heap (MB): | 21000 |
| JVM Maximum Heap (MB): | 21000 |
| JVM Address Bits: | 64 |
| Boot Firmware Version: | 2.00.25 |
| Management Firmware Version: | UIS-OM 1.00.10 |
| Workload Version: | SSJ 1.2.10 |
| Director Location: | Controller |
| Other Software: | Microsoft Windows KB3021910, clearcompressionflag.exe, KB2919355, KB2932046, KB2959977, KB2937592, KB2938439, KB2934018, KB4056898, patched to this test system in May 15, 2019 |
| JVM Instance | ssj_ops@100% |
|---|---|
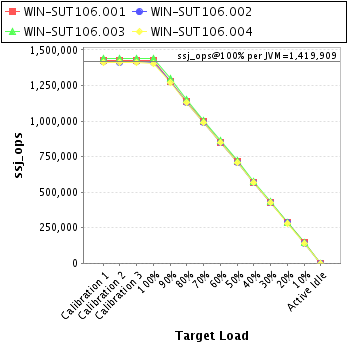
| WIN-SUT106.001 | 1,422,858 |
| WIN-SUT106.002 | 1,413,024 |
| WIN-SUT106.003 | 1,441,766 |
| WIN-SUT106.004 | 1,401,989 |
| ssj_ops@100% | 5,679,637 |
| ssj_ops@100% per JVM | 1,419,909 |
| Target Load | Actual Load | ssj_ops | |
|---|---|---|---|
| Target | Actual | ||
| Calibration 1 | 1,422,661 | ||
| Calibration 2 | 1,422,534 | ||
| Calibration 3 | 1,425,524 | ||
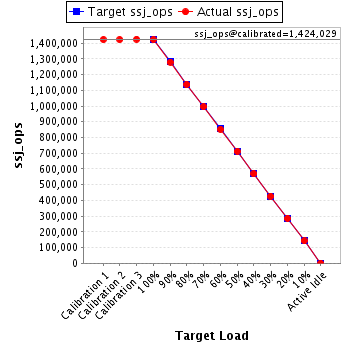
| ssj_ops@calibrated=1,424,029 | |||
| 100% | 99.9% | 1,424,029 | 1,422,858 |
| 90% | 89.9% | 1,281,626 | 1,279,802 |
| 80% | 79.9% | 1,139,223 | 1,137,428 |
| 70% | 69.9% | 996,820 | 995,502 |
| 60% | 59.9% | 854,417 | 852,332 |
| 50% | 50.0% | 712,015 | 712,535 |
| 40% | 39.9% | 569,612 | 568,774 |
| 30% | 30.0% | 427,209 | 427,328 |
| 20% | 20.0% | 284,806 | 285,371 |
| 10% | 10.0% | 142,403 | 142,602 |
| Active Idle | 0 | 0 | |
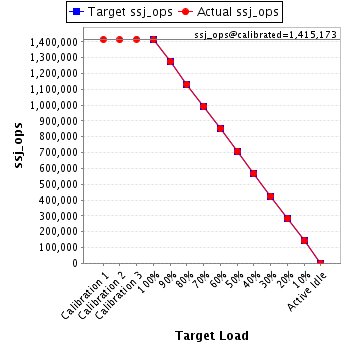
| Target Load | Actual Load | ssj_ops | |
|---|---|---|---|
| Target | Actual | ||
| Calibration 1 | 1,415,218 | ||
| Calibration 2 | 1,413,303 | ||
| Calibration 3 | 1,417,044 | ||
| ssj_ops@calibrated=1,415,173 | |||
| 100% | 99.8% | 1,415,173 | 1,413,024 |
| 90% | 90.1% | 1,273,656 | 1,274,620 |
| 80% | 80.0% | 1,132,139 | 1,131,552 |
| 70% | 70.1% | 990,621 | 991,959 |
| 60% | 60.2% | 849,104 | 851,450 |
| 50% | 50.1% | 707,587 | 708,843 |
| 40% | 40.1% | 566,069 | 567,052 |
| 30% | 30.0% | 424,552 | 424,374 |
| 20% | 20.0% | 283,035 | 283,217 |
| 10% | 10.0% | 141,517 | 142,056 |
| Active Idle | 0 | 0 | |
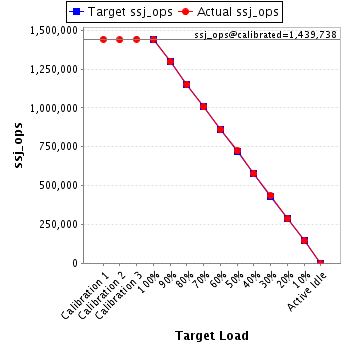
| Target Load | Actual Load | ssj_ops | |
|---|---|---|---|
| Target | Actual | ||
| Calibration 1 | 1,441,094 | ||
| Calibration 2 | 1,437,419 | ||
| Calibration 3 | 1,442,057 | ||
| ssj_ops@calibrated=1,439,738 | |||
| 100% | 100.1% | 1,439,738 | 1,441,766 |
| 90% | 90.0% | 1,295,764 | 1,296,112 |
| 80% | 80.0% | 1,151,790 | 1,151,884 |
| 70% | 69.9% | 1,007,817 | 1,005,710 |
| 60% | 59.9% | 863,843 | 861,877 |
| 50% | 50.2% | 719,869 | 722,715 |
| 40% | 40.1% | 575,895 | 576,678 |
| 30% | 30.1% | 431,921 | 432,875 |
| 20% | 19.8% | 287,948 | 284,836 |
| 10% | 10.0% | 143,974 | 144,548 |
| Active Idle | 0 | 0 | |
| Target Load | Actual Load | ssj_ops | |
|---|---|---|---|
| Target | Actual | ||
| Calibration 1 | 1,411,397 | ||
| Calibration 2 | 1,414,058 | ||
| Calibration 3 | 1,413,025 | ||
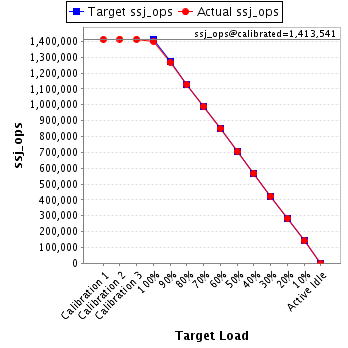
| ssj_ops@calibrated=1,413,541 | |||
| 100% | 99.2% | 1,413,541 | 1,401,989 |
| 90% | 89.7% | 1,272,187 | 1,267,970 |
| 80% | 79.8% | 1,130,833 | 1,128,339 |
| 70% | 70.0% | 989,479 | 989,174 |
| 60% | 60.1% | 848,125 | 850,085 |
| 50% | 50.0% | 706,771 | 706,348 |
| 40% | 40.1% | 565,417 | 567,034 |
| 30% | 30.0% | 424,062 | 424,089 |
| 20% | 20.0% | 282,708 | 282,905 |
| 10% | 10.0% | 141,354 | 141,221 |
| Active Idle | 0 | 0 | |