SPECpower_ssj2008
Host 'WIN-SUT102' Performance Report
Copyright © 2007-2019 Standard Performance Evaluation Corporation
| New H3C Technologies Co., Ltd. H3C UniServer B5700 G3 | ssj_ops@100% = 5,717,954 ssj_ops@100% per JVM = 1,429,488 |
||||
| Test Sponsor: | New H3C Technologies Co., Ltd. | SPEC License #: | 9066 | Test Method: | Multi Node |
| Tested By: | New H3C Technologies Co., Ltd. | Test Location: | Hangzhou, Zhejiang, China | Test Date: | May 17, 2019 |
| Hardware Availability: | Jan-2019 | Software Availability: | Jan-2019 | Publication: | Jun 12, 2019 |
| System Source: | Single Supplier | System Designation: | Server | Power Provisioning: | Line-powered |
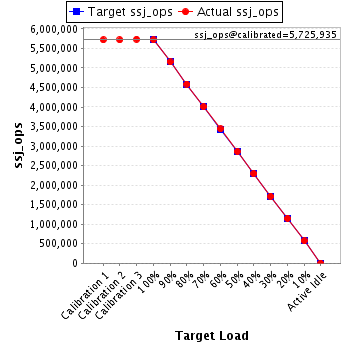
| Target Load | Actual Load | ssj_ops | |
|---|---|---|---|
| Target | Actual | ||
| Calibration 1 | 5,716,640 | ||
| Calibration 2 | 5,715,503 | ||
| Calibration 3 | 5,736,367 | ||
| ssj_ops@calibrated=5,725,935 | |||
| 100% | 99.9% | 5,725,935 | 5,717,954 |
| 90% | 90.0% | 5,153,342 | 5,153,306 |
| 80% | 80.1% | 4,580,748 | 4,587,746 |
| 70% | 70.0% | 4,008,155 | 4,006,482 |
| 60% | 60.0% | 3,435,561 | 3,438,229 |
| 50% | 50.0% | 2,862,968 | 2,861,098 |
| 40% | 40.0% | 2,290,374 | 2,291,915 |
| 30% | 30.0% | 1,717,781 | 1,715,494 |
| 20% | 20.0% | 1,145,187 | 1,147,710 |
| 10% | 10.0% | 572,594 | 574,612 |
| Active Idle | 0 | 0 | |
| Set Identifier: | sut |
| Set Description: | System Under Test |
| # of Identical Nodes: | 13 |
| Comment: | SUT |
| Hardware | |
|---|---|
| Hardware Vendor: | New H3C Technologies Co., Ltd. |
| Model: | H3C UniServer B5700 G3 |
| Form Factor: | Other |
| CPU Name: | Intel Xeon Platinum 8180 2.50GHz |
| CPU Characteristics: | 28-Core, 2.50 GHz, 38.5 MB L3 Cache |
| CPU Frequency (MHz): | 2500 |
| CPU(s) Enabled: | 56 cores, 2 chips, 28 cores/chip |
| Hardware Threads: | 112 (2 / core) |
| CPU(s) Orderable: | 1,2 chips |
| Primary Cache: | 32 KB I + 32 KB D on chip per core |
| Secondary Cache: | 1 MB I+D on chip per core |
| Tertiary Cache: | 39424 KB I+D on chip per chip |
| Other Cache: | None |
| Memory Amount (GB): | 192.0 |
| # and size of DIMM: | 12 x 16384 MB |
| Memory Details: | 12 x 16GB 2Rx8 PC4-2666-V ECC;slots A1, A2, A3, A4, A5, A6, B1, B2, B3, B4, B5, B6 populated |
| Power Supply Quantity and Rating (W): | None |
| Power Supply Details: | Shared |
| Disk Drive: | SATA DOM 128GB P/N DESSH-A28D09BCADCA |
| Disk Controller: | Integrated SATA controller |
| # and type of Network Interface Cards (NICs) Installed: | 1 x Intel I350 Gigabit Ethernet Controller |
| NICs Enabled in Firmware / OS / Connected: | 2/2/1 |
| Network Speed (Mbit): | 1000 |
| Keyboard: | None |
| Mouse: | None |
| Monitor: | None |
| Optical Drives: | No |
| Other Hardware: | None |
| Software | |
|---|---|
| Power Management: | Balanced Mode enabled in OS (see SUT Notes) |
| Operating System (OS): | Microsoft Windows Server 2012 R2 Datacenter |
| OS Version: | Version 6.3 (Build 9600) |
| Filesystem: | NTFS |
| JVM Vendor: | Oracle Corporation |
| JVM Version: | Java HotSpot(TM) 64-Bit Server VM (build 24.80-b11, mixed mode), version 1.7.0_80 |
| JVM Command-line Options: | -server -Xmn19g -Xms21g -Xmx21g -XX:SurvivorRatio=1 -XX:TargetSurvivorRatio=99 -XX:ParallelGCThreads=28 -XX:AllocatePrefetchDistance=256 -XX:AllocatePrefetchLines=4 -XX:LoopUnrollLimit=45 -XX:InitialTenuringThreshold=12 -XX:MaxTenuringThreshold=15 -XX:InlineSmallCode=9000 -XX:MaxInlineSize=270 -XX:FreqInlineSize=6000 -XX:+UseLargePages -XX:+UseParallelOldGC -XX:+AggressiveOpts |
| JVM Affinity: | start /NODE [0,2] /AFFINITY [0xFC0FF00FC0FF];start /NODE [1,3] /AFFINITY [0xFF03F00FF03F] |
| JVM Instances: | 4 |
| JVM Initial Heap (MB): | 21000 |
| JVM Maximum Heap (MB): | 21000 |
| JVM Address Bits: | 64 |
| Boot Firmware Version: | 2.00.25 |
| Management Firmware Version: | UIS-OM 1.00.10 |
| Workload Version: | SSJ 1.2.10 |
| Director Location: | Controller |
| Other Software: | Microsoft Windows KB3021910, clearcompressionflag.exe, KB2919355, KB2932046, KB2959977, KB2937592, KB2938439, KB2934018, KB4056898, patched to this test system in May 15, 2019 |
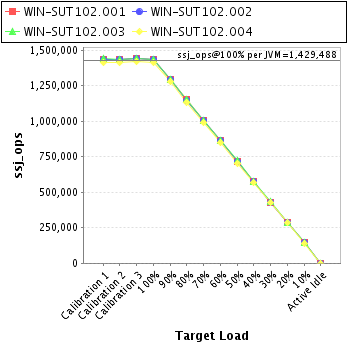
| JVM Instance | ssj_ops@100% |
|---|---|
| WIN-SUT102.001 | 1,435,244 |
| WIN-SUT102.002 | 1,432,911 |
| WIN-SUT102.003 | 1,435,858 |
| WIN-SUT102.004 | 1,413,941 |
| ssj_ops@100% | 5,717,954 |
| ssj_ops@100% per JVM | 1,429,488 |
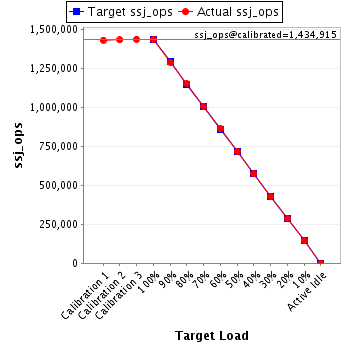
| Target Load | Actual Load | ssj_ops | |
|---|---|---|---|
| Target | Actual | ||
| Calibration 1 | 1,431,350 | ||
| Calibration 2 | 1,432,434 | ||
| Calibration 3 | 1,437,396 | ||
| ssj_ops@calibrated=1,434,915 | |||
| 100% | 100.0% | 1,434,915 | 1,435,244 |
| 90% | 89.9% | 1,291,423 | 1,289,673 |
| 80% | 80.3% | 1,147,932 | 1,152,729 |
| 70% | 70.2% | 1,004,440 | 1,006,993 |
| 60% | 60.1% | 860,949 | 863,016 |
| 50% | 50.0% | 717,457 | 716,991 |
| 40% | 39.9% | 573,966 | 572,612 |
| 30% | 29.8% | 430,474 | 427,809 |
| 20% | 20.1% | 286,983 | 288,203 |
| 10% | 10.1% | 143,491 | 144,626 |
| Active Idle | 0 | 0 | |
| Target Load | Actual Load | ssj_ops | |
|---|---|---|---|
| Target | Actual | ||
| Calibration 1 | 1,434,167 | ||
| Calibration 2 | 1,433,767 | ||
| Calibration 3 | 1,436,768 | ||
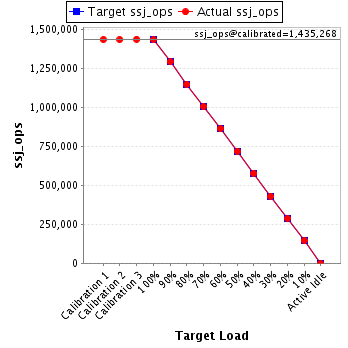
| ssj_ops@calibrated=1,435,268 | |||
| 100% | 99.8% | 1,435,268 | 1,432,911 |
| 90% | 90.0% | 1,291,741 | 1,291,624 |
| 80% | 80.0% | 1,148,214 | 1,147,954 |
| 70% | 70.0% | 1,004,687 | 1,004,338 |
| 60% | 60.1% | 861,161 | 862,166 |
| 50% | 50.1% | 717,634 | 718,665 |
| 40% | 40.1% | 574,107 | 576,130 |
| 30% | 30.0% | 430,580 | 430,541 |
| 20% | 20.0% | 287,054 | 287,054 |
| 10% | 10.1% | 143,527 | 144,734 |
| Active Idle | 0 | 0 | |
| Target Load | Actual Load | ssj_ops | |
|---|---|---|---|
| Target | Actual | ||
| Calibration 1 | 1,438,606 | ||
| Calibration 2 | 1,436,164 | ||
| Calibration 3 | 1,442,474 | ||
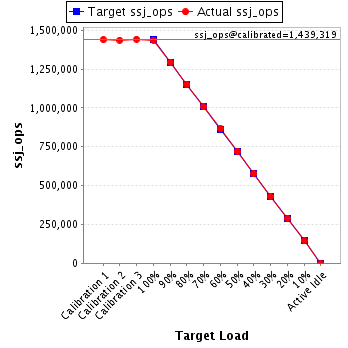
| ssj_ops@calibrated=1,439,319 | |||
| 100% | 99.8% | 1,439,319 | 1,435,858 |
| 90% | 89.9% | 1,295,387 | 1,294,561 |
| 80% | 80.2% | 1,151,455 | 1,153,619 |
| 70% | 70.0% | 1,007,523 | 1,007,002 |
| 60% | 60.2% | 863,591 | 866,416 |
| 50% | 50.1% | 719,659 | 721,092 |
| 40% | 40.0% | 575,728 | 575,421 |
| 30% | 30.0% | 431,796 | 431,500 |
| 20% | 20.1% | 287,864 | 289,163 |
| 10% | 10.0% | 143,932 | 144,157 |
| Active Idle | 0 | 0 | |
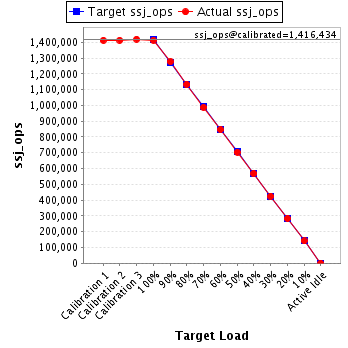
| Target Load | Actual Load | ssj_ops | |
|---|---|---|---|
| Target | Actual | ||
| Calibration 1 | 1,412,517 | ||
| Calibration 2 | 1,413,138 | ||
| Calibration 3 | 1,419,730 | ||
| ssj_ops@calibrated=1,416,434 | |||
| 100% | 99.8% | 1,416,434 | 1,413,941 |
| 90% | 90.2% | 1,274,790 | 1,277,448 |
| 80% | 80.0% | 1,133,147 | 1,133,444 |
| 70% | 69.8% | 991,504 | 988,150 |
| 60% | 59.8% | 849,860 | 846,631 |
| 50% | 49.7% | 708,217 | 704,350 |
| 40% | 40.1% | 566,574 | 567,752 |
| 30% | 30.1% | 424,930 | 425,645 |
| 20% | 20.0% | 283,287 | 283,290 |
| 10% | 10.0% | 141,643 | 141,095 |
| Active Idle | 0 | 0 | |