SPECpower_ssj2008
Host 'WIN-SUT109' Performance Report
Copyright © 2007-2019 Standard Performance Evaluation Corporation
| New H3C Technologies Co., Ltd. H3C UniServer B5700 G3 | ssj_ops@100% = 5,690,033 ssj_ops@100% per JVM = 1,422,508 |
||||
| Test Sponsor: | New H3C Technologies Co., Ltd. | SPEC License #: | 9066 | Test Method: | Multi Node |
| Tested By: | New H3C Technologies Co., Ltd. | Test Location: | Hangzhou, Zhejiang, China | Test Date: | May 13, 2019 |
| Hardware Availability: | Jan-2019 | Software Availability: | Jan-2019 | Publication: | Jun 12, 2019 |
| System Source: | Single Supplier | System Designation: | Server | Power Provisioning: | Line-powered |
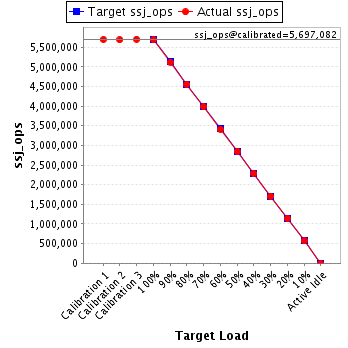
| Target Load | Actual Load | ssj_ops | |
|---|---|---|---|
| Target | Actual | ||
| Calibration 1 | 5,696,252 | ||
| Calibration 2 | 5,689,244 | ||
| Calibration 3 | 5,704,920 | ||
| ssj_ops@calibrated=5,697,082 | |||
| 100% | 99.9% | 5,697,082 | 5,690,033 |
| 90% | 89.9% | 5,127,374 | 5,123,470 |
| 80% | 80.0% | 4,557,666 | 4,559,086 |
| 70% | 70.0% | 3,987,957 | 3,985,778 |
| 60% | 59.9% | 3,418,249 | 3,415,250 |
| 50% | 50.0% | 2,848,541 | 2,847,171 |
| 40% | 40.0% | 2,278,833 | 2,280,213 |
| 30% | 30.0% | 1,709,125 | 1,709,800 |
| 20% | 20.0% | 1,139,416 | 1,139,706 |
| 10% | 10.0% | 569,708 | 570,782 |
| Active Idle | 0 | 0 | |
| Set Identifier: | sut |
| Set Description: | System Under Test |
| # of Identical Nodes: | 12 |
| Comment: | SUT |
| Hardware | |
|---|---|
| Hardware Vendor: | New H3C Technologies Co., Ltd. |
| Model: | H3C UniServer B5700 G3 |
| Form Factor: | Other |
| CPU Name: | Intel Xeon Platinum 8180 2.50GHz |
| CPU Characteristics: | 28-Core, 2.50 GHz, 38.5 MB L3 Cache |
| CPU Frequency (MHz): | 2500 |
| CPU(s) Enabled: | 56 cores, 2 chips, 28 cores/chip |
| Hardware Threads: | 112 (2 / core) |
| CPU(s) Orderable: | 1,2 chips |
| Primary Cache: | 32 KB I + 32 KB D on chip per core |
| Secondary Cache: | 1 MB I+D on chip per core |
| Tertiary Cache: | 39424 KB I+D on chip per chip |
| Other Cache: | None |
| Memory Amount (GB): | 192.0 |
| # and size of DIMM: | 12 x 16384 MB |
| Memory Details: | 12 x 16GB 2Rx8 PC4-2666-V ECC;slots A1, A2, A3, A4, A5, A6, B1, B2, B3, B4, B5, B6 populated |
| Power Supply Quantity and Rating (W): | None |
| Power Supply Details: | Shared |
| Disk Drive: | SATA DOM 128GB P/N DESSH-A28D09BCADCA |
| Disk Controller: | Integrated SATA controller |
| # and type of Network Interface Cards (NICs) Installed: | 1 x Intel I350 Gigabit Ethernet Controller |
| NICs Enabled in Firmware / OS / Connected: | 2/2/1 |
| Network Speed (Mbit): | 1000 |
| Keyboard: | None |
| Mouse: | None |
| Monitor: | None |
| Optical Drives: | No |
| Other Hardware: | None |
| Software | |
|---|---|
| Power Management: | Balanced Mode enabled in OS (see SUT Notes) |
| Operating System (OS): | Microsoft Windows Server 2012 R2 Datacenter |
| OS Version: | Version 6.3 (Build 9600) |
| Filesystem: | NTFS |
| JVM Vendor: | Oracle Corporation |
| JVM Version: | Java HotSpot(TM) 64-Bit Server VM (build 24.80-b11, mixed mode), version 1.7.0_80 |
| JVM Command-line Options: | -server -Xmn19g -Xms21g -Xmx21g -XX:SurvivorRatio=1 -XX:TargetSurvivorRatio=99 -XX:ParallelGCThreads=28 -XX:AllocatePrefetchDistance=256 -XX:AllocatePrefetchLines=4 -XX:LoopUnrollLimit=45 -XX:InitialTenuringThreshold=12 -XX:MaxTenuringThreshold=15 -XX:InlineSmallCode=9000 -XX:MaxInlineSize=270 -XX:FreqInlineSize=6000 -XX:+UseLargePages -XX:+UseParallelOldGC -XX:+AggressiveOpts |
| JVM Affinity: | start /NODE [0,2] /AFFINITY [0xFC0FF00FC0FF];start /NODE [1,3] /AFFINITY [0xFF03F00FF03F] |
| JVM Instances: | 4 |
| JVM Initial Heap (MB): | 21000 |
| JVM Maximum Heap (MB): | 21000 |
| JVM Address Bits: | 64 |
| Boot Firmware Version: | 2.00.25 |
| Management Firmware Version: | UIS-OM 1.00.10 |
| Workload Version: | SSJ 1.2.10 |
| Director Location: | Controller |
| Other Software: | Microsoft Windows KB3021910, clearcompressionflag.exe, KB2919355, KB2932046, KB2959977, KB2937592, KB2938439, KB2934018, KB4056898, patched to this test system in May 8, 2019 |
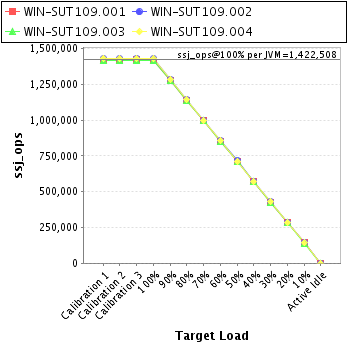
| JVM Instance | ssj_ops@100% |
|---|---|
| WIN-SUT109.001 | 1,418,560 |
| WIN-SUT109.002 | 1,428,157 |
| WIN-SUT109.003 | 1,416,115 |
| WIN-SUT109.004 | 1,427,201 |
| ssj_ops@100% | 5,690,033 |
| ssj_ops@100% per JVM | 1,422,508 |
| Target Load | Actual Load | ssj_ops | |
|---|---|---|---|
| Target | Actual | ||
| Calibration 1 | 1,417,384 | ||
| Calibration 2 | 1,417,923 | ||
| Calibration 3 | 1,422,775 | ||
| ssj_ops@calibrated=1,420,349 | |||
| 100% | 99.9% | 1,420,349 | 1,418,560 |
| 90% | 90.0% | 1,278,314 | 1,277,610 |
| 80% | 80.1% | 1,136,279 | 1,137,137 |
| 70% | 70.0% | 994,244 | 994,065 |
| 60% | 59.8% | 852,210 | 849,922 |
| 50% | 50.0% | 710,175 | 710,300 |
| 40% | 40.0% | 568,140 | 567,735 |
| 30% | 30.1% | 426,105 | 426,906 |
| 20% | 20.0% | 284,070 | 283,792 |
| 10% | 10.1% | 142,035 | 142,801 |
| Active Idle | 0 | 0 | |

| Target Load | Actual Load | ssj_ops | |
|---|---|---|---|
| Target | Actual | ||
| Calibration 1 | 1,429,207 | ||
| Calibration 2 | 1,427,293 | ||
| Calibration 3 | 1,431,930 | ||
| ssj_ops@calibrated=1,429,611 | |||
| 100% | 99.9% | 1,429,611 | 1,428,157 |
| 90% | 89.9% | 1,286,650 | 1,284,684 |
| 80% | 80.0% | 1,143,689 | 1,144,298 |
| 70% | 69.7% | 1,000,728 | 996,819 |
| 60% | 60.0% | 857,767 | 857,955 |
| 50% | 50.1% | 714,806 | 716,098 |
| 40% | 40.1% | 571,845 | 572,856 |
| 30% | 30.0% | 428,883 | 429,031 |
| 20% | 20.0% | 285,922 | 286,326 |
| 10% | 10.1% | 142,961 | 143,957 |
| Active Idle | 0 | 0 | |

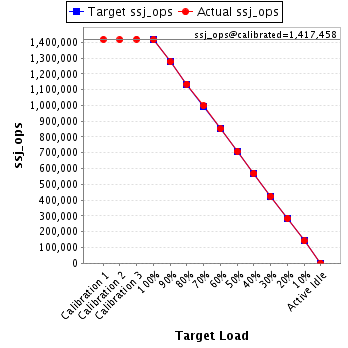
| Target Load | Actual Load | ssj_ops | |
|---|---|---|---|
| Target | Actual | ||
| Calibration 1 | 1,417,153 | ||
| Calibration 2 | 1,415,441 | ||
| Calibration 3 | 1,419,476 | ||
| ssj_ops@calibrated=1,417,458 | |||
| 100% | 99.9% | 1,417,458 | 1,416,115 |
| 90% | 90.1% | 1,275,713 | 1,276,529 |
| 80% | 80.1% | 1,133,967 | 1,134,681 |
| 70% | 70.4% | 992,221 | 997,645 |
| 60% | 60.1% | 850,475 | 851,599 |
| 50% | 50.0% | 708,729 | 708,877 |
| 40% | 40.1% | 566,983 | 568,745 |
| 30% | 30.0% | 425,238 | 424,986 |
| 20% | 20.1% | 283,492 | 284,544 |
| 10% | 10.0% | 141,746 | 141,494 |
| Active Idle | 0 | 0 | |
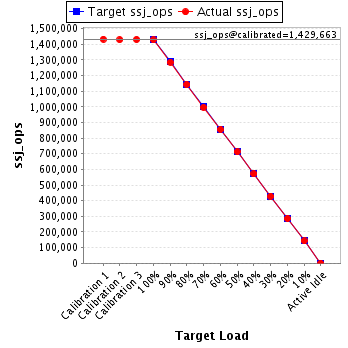
| Target Load | Actual Load | ssj_ops | |
|---|---|---|---|
| Target | Actual | ||
| Calibration 1 | 1,432,508 | ||
| Calibration 2 | 1,428,586 | ||
| Calibration 3 | 1,430,740 | ||
| ssj_ops@calibrated=1,429,663 | |||
| 100% | 99.8% | 1,429,663 | 1,427,201 |
| 90% | 89.9% | 1,286,697 | 1,284,646 |
| 80% | 79.9% | 1,143,730 | 1,142,970 |
| 70% | 69.8% | 1,000,764 | 997,250 |
| 60% | 59.9% | 857,798 | 855,773 |
| 50% | 49.8% | 714,831 | 711,896 |
| 40% | 39.9% | 571,865 | 570,877 |
| 30% | 30.0% | 428,899 | 428,876 |
| 20% | 19.9% | 285,933 | 285,043 |
| 10% | 10.0% | 142,966 | 142,530 |
| Active Idle | 0 | 0 | |