SPECpower_ssj2008
Host 'WIN-SUT106' Performance Report
Copyright © 2007-2019 Standard Performance Evaluation Corporation
| New H3C Technologies Co., Ltd. H3C UniServer B5700 G3 | ssj_ops@100% = 5,695,014 ssj_ops@100% per JVM = 1,423,753 |
||||
| Test Sponsor: | New H3C Technologies Co., Ltd. | SPEC License #: | 9066 | Test Method: | Multi Node |
| Tested By: | New H3C Technologies Co., Ltd. | Test Location: | Hangzhou, Zhejiang, China | Test Date: | May 13, 2019 |
| Hardware Availability: | Jan-2019 | Software Availability: | Jan-2019 | Publication: | Jun 12, 2019 |
| System Source: | Single Supplier | System Designation: | Server | Power Provisioning: | Line-powered |
| Target Load | Actual Load | ssj_ops | |
|---|---|---|---|
| Target | Actual | ||
| Calibration 1 | 5,692,698 | ||
| Calibration 2 | 5,688,785 | ||
| Calibration 3 | 5,707,012 | ||
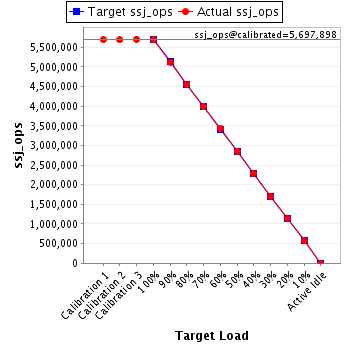
| ssj_ops@calibrated=5,697,898 | |||
| 100% | 99.9% | 5,697,898 | 5,695,014 |
| 90% | 89.9% | 5,128,109 | 5,123,273 |
| 80% | 80.0% | 4,558,319 | 4,558,718 |
| 70% | 70.0% | 3,988,529 | 3,987,044 |
| 60% | 60.0% | 3,418,739 | 3,419,323 |
| 50% | 50.1% | 2,848,949 | 2,855,128 |
| 40% | 40.1% | 2,279,159 | 2,282,740 |
| 30% | 29.9% | 1,709,370 | 1,704,850 |
| 20% | 20.1% | 1,139,580 | 1,142,432 |
| 10% | 10.0% | 569,790 | 568,464 |
| Active Idle | 0 | 0 | |
| Set Identifier: | sut |
| Set Description: | System Under Test |
| # of Identical Nodes: | 12 |
| Comment: | SUT |
| Hardware | |
|---|---|
| Hardware Vendor: | New H3C Technologies Co., Ltd. |
| Model: | H3C UniServer B5700 G3 |
| Form Factor: | Other |
| CPU Name: | Intel Xeon Platinum 8180 2.50GHz |
| CPU Characteristics: | 28-Core, 2.50 GHz, 38.5 MB L3 Cache |
| CPU Frequency (MHz): | 2500 |
| CPU(s) Enabled: | 56 cores, 2 chips, 28 cores/chip |
| Hardware Threads: | 112 (2 / core) |
| CPU(s) Orderable: | 1,2 chips |
| Primary Cache: | 32 KB I + 32 KB D on chip per core |
| Secondary Cache: | 1 MB I+D on chip per core |
| Tertiary Cache: | 39424 KB I+D on chip per chip |
| Other Cache: | None |
| Memory Amount (GB): | 192.0 |
| # and size of DIMM: | 12 x 16384 MB |
| Memory Details: | 12 x 16GB 2Rx8 PC4-2666-V ECC;slots A1, A2, A3, A4, A5, A6, B1, B2, B3, B4, B5, B6 populated |
| Power Supply Quantity and Rating (W): | None |
| Power Supply Details: | Shared |
| Disk Drive: | SATA DOM 128GB P/N DESSH-A28D09BCADCA |
| Disk Controller: | Integrated SATA controller |
| # and type of Network Interface Cards (NICs) Installed: | 1 x Intel I350 Gigabit Ethernet Controller |
| NICs Enabled in Firmware / OS / Connected: | 2/2/1 |
| Network Speed (Mbit): | 1000 |
| Keyboard: | None |
| Mouse: | None |
| Monitor: | None |
| Optical Drives: | No |
| Other Hardware: | None |
| Software | |
|---|---|
| Power Management: | Balanced Mode enabled in OS (see SUT Notes) |
| Operating System (OS): | Microsoft Windows Server 2012 R2 Datacenter |
| OS Version: | Version 6.3 (Build 9600) |
| Filesystem: | NTFS |
| JVM Vendor: | Oracle Corporation |
| JVM Version: | Java HotSpot(TM) 64-Bit Server VM (build 24.80-b11, mixed mode), version 1.7.0_80 |
| JVM Command-line Options: | -server -Xmn19g -Xms21g -Xmx21g -XX:SurvivorRatio=1 -XX:TargetSurvivorRatio=99 -XX:ParallelGCThreads=28 -XX:AllocatePrefetchDistance=256 -XX:AllocatePrefetchLines=4 -XX:LoopUnrollLimit=45 -XX:InitialTenuringThreshold=12 -XX:MaxTenuringThreshold=15 -XX:InlineSmallCode=9000 -XX:MaxInlineSize=270 -XX:FreqInlineSize=6000 -XX:+UseLargePages -XX:+UseParallelOldGC -XX:+AggressiveOpts |
| JVM Affinity: | start /NODE [0,2] /AFFINITY [0xFC0FF00FC0FF];start /NODE [1,3] /AFFINITY [0xFF03F00FF03F] |
| JVM Instances: | 4 |
| JVM Initial Heap (MB): | 21000 |
| JVM Maximum Heap (MB): | 21000 |
| JVM Address Bits: | 64 |
| Boot Firmware Version: | 2.00.25 |
| Management Firmware Version: | UIS-OM 1.00.10 |
| Workload Version: | SSJ 1.2.10 |
| Director Location: | Controller |
| Other Software: | Microsoft Windows KB3021910, clearcompressionflag.exe, KB2919355, KB2932046, KB2959977, KB2937592, KB2938439, KB2934018, KB4056898, patched to this test system in May 8, 2019 |
| JVM Instance | ssj_ops@100% |
|---|---|
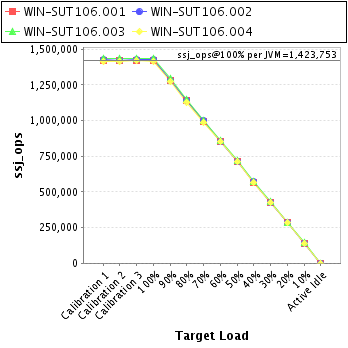
| WIN-SUT106.001 | 1,418,274 |
| WIN-SUT106.002 | 1,426,248 |
| WIN-SUT106.003 | 1,432,645 |
| WIN-SUT106.004 | 1,417,847 |
| ssj_ops@100% | 5,695,014 |
| ssj_ops@100% per JVM | 1,423,753 |
| Target Load | Actual Load | ssj_ops | |
|---|---|---|---|
| Target | Actual | ||
| Calibration 1 | 1,419,728 | ||
| Calibration 2 | 1,419,265 | ||
| Calibration 3 | 1,424,067 | ||
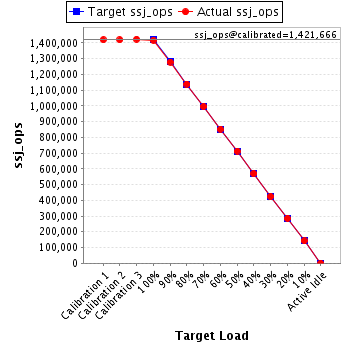
| ssj_ops@calibrated=1,421,666 | |||
| 100% | 99.8% | 1,421,666 | 1,418,274 |
| 90% | 90.0% | 1,279,500 | 1,278,806 |
| 80% | 80.1% | 1,137,333 | 1,139,065 |
| 70% | 70.1% | 995,166 | 996,454 |
| 60% | 60.0% | 853,000 | 853,183 |
| 50% | 50.2% | 710,833 | 713,053 |
| 40% | 40.0% | 568,666 | 568,634 |
| 30% | 29.8% | 426,500 | 423,391 |
| 20% | 20.1% | 284,333 | 286,054 |
| 10% | 10.0% | 142,167 | 141,964 |
| Active Idle | 0 | 0 | |
| Target Load | Actual Load | ssj_ops | |
|---|---|---|---|
| Target | Actual | ||
| Calibration 1 | 1,425,352 | ||
| Calibration 2 | 1,422,771 | ||
| Calibration 3 | 1,426,032 | ||
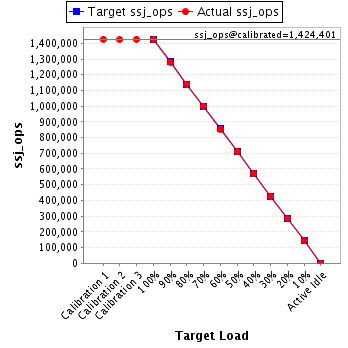
| ssj_ops@calibrated=1,424,401 | |||
| 100% | 100.1% | 1,424,401 | 1,426,248 |
| 90% | 89.9% | 1,281,961 | 1,280,815 |
| 80% | 80.1% | 1,139,521 | 1,140,631 |
| 70% | 70.1% | 997,081 | 998,717 |
| 60% | 60.0% | 854,641 | 854,362 |
| 50% | 50.0% | 712,201 | 711,853 |
| 40% | 40.1% | 569,761 | 571,467 |
| 30% | 29.9% | 427,320 | 425,484 |
| 20% | 20.0% | 284,880 | 284,595 |
| 10% | 10.0% | 142,440 | 142,029 |
| Active Idle | 0 | 0 | |
| Target Load | Actual Load | ssj_ops | |
|---|---|---|---|
| Target | Actual | ||
| Calibration 1 | 1,433,109 | ||
| Calibration 2 | 1,431,998 | ||
| Calibration 3 | 1,437,736 | ||
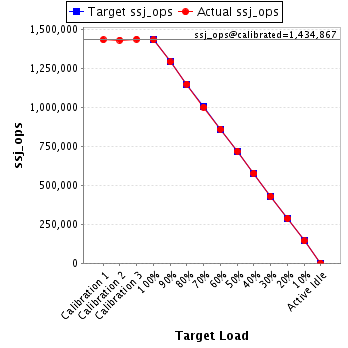
| ssj_ops@calibrated=1,434,867 | |||
| 100% | 99.8% | 1,434,867 | 1,432,645 |
| 90% | 90.0% | 1,291,380 | 1,292,046 |
| 80% | 80.1% | 1,147,894 | 1,149,011 |
| 70% | 69.8% | 1,004,407 | 1,002,098 |
| 60% | 60.0% | 860,920 | 860,337 |
| 50% | 50.1% | 717,433 | 718,951 |
| 40% | 40.1% | 573,947 | 576,010 |
| 30% | 29.9% | 430,460 | 429,596 |
| 20% | 20.0% | 286,973 | 287,604 |
| 10% | 10.0% | 143,487 | 143,993 |
| Active Idle | 0 | 0 | |
| Target Load | Actual Load | ssj_ops | |
|---|---|---|---|
| Target | Actual | ||
| Calibration 1 | 1,414,509 | ||
| Calibration 2 | 1,414,751 | ||
| Calibration 3 | 1,419,177 | ||
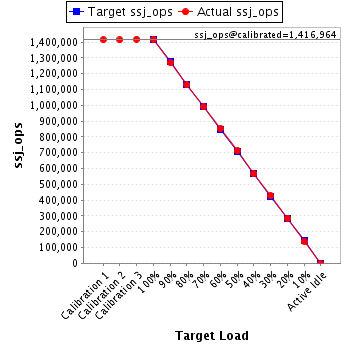
| ssj_ops@calibrated=1,416,964 | |||
| 100% | 100.1% | 1,416,964 | 1,417,847 |
| 90% | 89.7% | 1,275,268 | 1,271,606 |
| 80% | 79.7% | 1,133,571 | 1,130,011 |
| 70% | 69.9% | 991,875 | 989,775 |
| 60% | 60.1% | 850,178 | 851,441 |
| 50% | 50.2% | 708,482 | 711,270 |
| 40% | 40.0% | 566,786 | 566,629 |
| 30% | 30.1% | 425,089 | 426,379 |
| 20% | 20.1% | 283,393 | 284,179 |
| 10% | 9.9% | 141,696 | 140,478 |
| Active Idle | 0 | 0 | |