SPECpower_ssj2008
Host 'WIN-SUT107' Performance Report
Copyright © 2007-2019 Standard Performance Evaluation Corporation
| New H3C Technologies Co., Ltd. H3C UniServer B5700 G3 | ssj_ops@100% = 5,707,910 ssj_ops@100% per JVM = 1,426,977 |
||||
| Test Sponsor: | New H3C Technologies Co., Ltd. | SPEC License #: | 9066 | Test Method: | Multi Node |
| Tested By: | New H3C Technologies Co., Ltd. | Test Location: | Hangzhou, Zhejiang, China | Test Date: | May 6, 2019 |
| Hardware Availability: | Jan-2019 | Software Availability: | Jan-2019 | Publication: | Jun 5, 2019 |
| System Source: | Single Supplier | System Designation: | Server | Power Provisioning: | Line-powered |
| Target Load | Actual Load | ssj_ops | |
|---|---|---|---|
| Target | Actual | ||
| Calibration 1 | 5,723,959 | ||
| Calibration 2 | 5,719,137 | ||
| Calibration 3 | 5,739,244 | ||
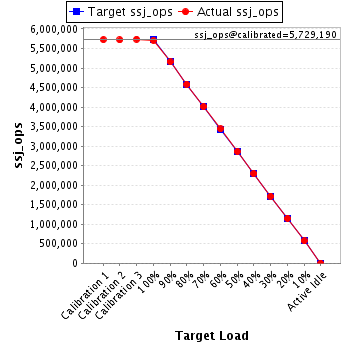
| ssj_ops@calibrated=5,729,190 | |||
| 100% | 99.6% | 5,729,190 | 5,707,910 |
| 90% | 90.0% | 5,156,271 | 5,156,389 |
| 80% | 80.0% | 4,583,352 | 4,583,095 |
| 70% | 70.0% | 4,010,433 | 4,012,463 |
| 60% | 60.0% | 3,437,514 | 3,439,061 |
| 50% | 49.9% | 2,864,595 | 2,861,028 |
| 40% | 40.0% | 2,291,676 | 2,293,462 |
| 30% | 30.0% | 1,718,757 | 1,720,059 |
| 20% | 20.0% | 1,145,838 | 1,148,142 |
| 10% | 10.0% | 572,919 | 574,048 |
| Active Idle | 0 | 0 | |
| Set Identifier: | sut |
| Set Description: | System Under Test |
| # of Identical Nodes: | 9 |
| Comment: | SUT |
| Hardware | |
|---|---|
| Hardware Vendor: | New H3C Technologies Co., Ltd. |
| Model: | H3C UniServer B5700 G3 |
| Form Factor: | Other |
| CPU Name: | Intel Xeon Platinum 8180 2.50GHz |
| CPU Characteristics: | 28-Core, 2.50 GHz, 38.5 MB L3 Cache |
| CPU Frequency (MHz): | 2500 |
| CPU(s) Enabled: | 56 cores, 2 chips, 28 cores/chip |
| Hardware Threads: | 112 (2 / core) |
| CPU(s) Orderable: | 1,2 chips |
| Primary Cache: | 32 KB I + 32 KB D on chip per core |
| Secondary Cache: | 1 MB I+D on chip per core |
| Tertiary Cache: | 39424 KB I+D on chip per chip |
| Other Cache: | None |
| Memory Amount (GB): | 192.0 |
| # and size of DIMM: | 12 x 16384 MB |
| Memory Details: | 12 x 16GB 2Rx8 PC4-2666-V ECC;slots A1, A2, A3, A4, A5, A6, B1, B2, B3, B4, B5, B6 populated |
| Power Supply Quantity and Rating (W): | None |
| Power Supply Details: | Shared |
| Disk Drive: | SATA DOM 128GB P/N DESSH-A28D09BCADCA |
| Disk Controller: | Integrated SATA controller |
| # and type of Network Interface Cards (NICs) Installed: | 1 x Intel I350 Gigabit Ethernet Controller |
| NICs Enabled in Firmware / OS / Connected: | 2/2/1 |
| Network Speed (Mbit): | 1000 |
| Keyboard: | None |
| Mouse: | None |
| Monitor: | None |
| Optical Drives: | No |
| Other Hardware: | None |
| Software | |
|---|---|
| Power Management: | Balanced Mode enabled in OS (see SUT Notes) |
| Operating System (OS): | Microsoft Windows Server 2012 R2 Datacenter |
| OS Version: | Version 6.3 (Build 9600) |
| Filesystem: | NTFS |
| JVM Vendor: | Oracle Corporation |
| JVM Version: | Java HotSpot(TM) 64-Bit Server VM (build 24.80-b11, mixed mode), version 1.7.0_80 |
| JVM Command-line Options: | -server -Xmn19g -Xms21g -Xmx21g -XX:SurvivorRatio=1 -XX:TargetSurvivorRatio=99 -XX:ParallelGCThreads=28 -XX:AllocatePrefetchDistance=256 -XX:AllocatePrefetchLines=4 -XX:LoopUnrollLimit=45 -XX:InitialTenuringThreshold=12 -XX:MaxTenuringThreshold=15 -XX:InlineSmallCode=9000 -XX:MaxInlineSize=270 -XX:FreqInlineSize=6000 -XX:+UseLargePages -XX:+UseParallelOldGC -XX:+AggressiveOpts |
| JVM Affinity: | start /NODE [0,2] /AFFINITY [0xFC0FF00FC0FF];start /NODE [1,3] /AFFINITY [0xFF03F00FF03F] |
| JVM Instances: | 4 |
| JVM Initial Heap (MB): | 21000 |
| JVM Maximum Heap (MB): | 21000 |
| JVM Address Bits: | 64 |
| Boot Firmware Version: | 2.00.25 |
| Management Firmware Version: | UIS-OM 1.00.10 |
| Workload Version: | SSJ 1.2.10 |
| Director Location: | Controller |
| Other Software: | Microsoft Windows KB3021910, clearcompressionflag.exe, KB2919355, KB2932046, KB2959977, KB2937592, KB2938439, KB2934018, KB4056898, patched to this test system in May 05, 2019 |
| JVM Instance | ssj_ops@100% |
|---|---|
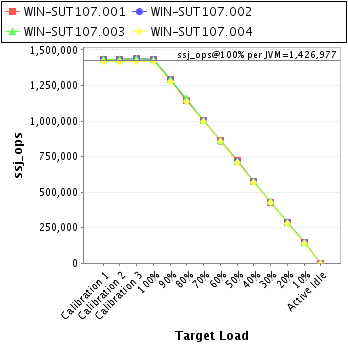
| WIN-SUT107.001 | 1,430,238 |
| WIN-SUT107.002 | 1,429,783 |
| WIN-SUT107.003 | 1,432,180 |
| WIN-SUT107.004 | 1,415,709 |
| ssj_ops@100% | 5,707,910 |
| ssj_ops@100% per JVM | 1,426,977 |
| Target Load | Actual Load | ssj_ops | |
|---|---|---|---|
| Target | Actual | ||
| Calibration 1 | 1,435,495 | ||
| Calibration 2 | 1,433,672 | ||
| Calibration 3 | 1,436,916 | ||
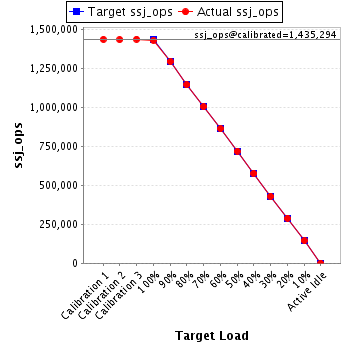
| ssj_ops@calibrated=1,435,294 | |||
| 100% | 99.6% | 1,435,294 | 1,430,238 |
| 90% | 90.1% | 1,291,764 | 1,293,634 |
| 80% | 79.8% | 1,148,235 | 1,144,863 |
| 70% | 70.0% | 1,004,706 | 1,004,536 |
| 60% | 60.1% | 861,176 | 862,531 |
| 50% | 50.1% | 717,647 | 719,263 |
| 40% | 40.1% | 574,117 | 575,711 |
| 30% | 29.9% | 430,588 | 429,494 |
| 20% | 20.1% | 287,059 | 289,171 |
| 10% | 10.1% | 143,529 | 145,336 |
| Active Idle | 0 | 0 | |
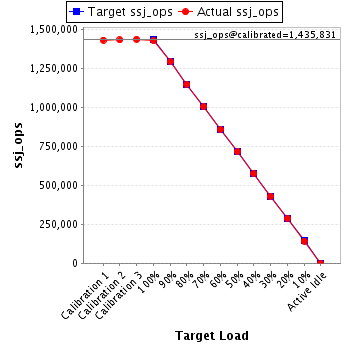
| Target Load | Actual Load | ssj_ops | |
|---|---|---|---|
| Target | Actual | ||
| Calibration 1 | 1,432,813 | ||
| Calibration 2 | 1,433,264 | ||
| Calibration 3 | 1,438,399 | ||
| ssj_ops@calibrated=1,435,831 | |||
| 100% | 99.6% | 1,435,831 | 1,429,783 |
| 90% | 90.1% | 1,292,248 | 1,293,714 |
| 80% | 80.0% | 1,148,665 | 1,148,091 |
| 70% | 70.1% | 1,005,082 | 1,007,016 |
| 60% | 59.8% | 861,499 | 859,048 |
| 50% | 49.9% | 717,916 | 716,491 |
| 40% | 40.0% | 574,332 | 574,898 |
| 30% | 30.0% | 430,749 | 430,845 |
| 20% | 20.0% | 287,166 | 287,813 |
| 10% | 9.9% | 143,583 | 142,644 |
| Active Idle | 0 | 0 | |
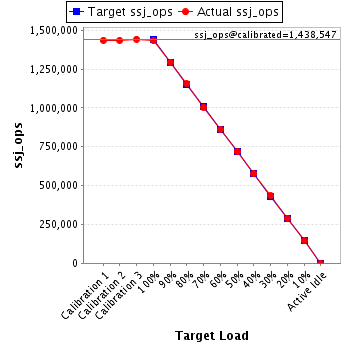
| Target Load | Actual Load | ssj_ops | |
|---|---|---|---|
| Target | Actual | ||
| Calibration 1 | 1,434,695 | ||
| Calibration 2 | 1,434,689 | ||
| Calibration 3 | 1,442,405 | ||
| ssj_ops@calibrated=1,438,547 | |||
| 100% | 99.6% | 1,438,547 | 1,432,180 |
| 90% | 89.9% | 1,294,692 | 1,293,641 |
| 80% | 80.3% | 1,150,838 | 1,155,617 |
| 70% | 69.9% | 1,006,983 | 1,005,437 |
| 60% | 60.0% | 863,128 | 863,376 |
| 50% | 49.9% | 719,273 | 718,338 |
| 40% | 40.0% | 575,419 | 575,873 |
| 30% | 30.2% | 431,564 | 434,015 |
| 20% | 20.1% | 287,709 | 289,103 |
| 10% | 10.0% | 143,855 | 144,358 |
| Active Idle | 0 | 0 | |
| Target Load | Actual Load | ssj_ops | |
|---|---|---|---|
| Target | Actual | ||
| Calibration 1 | 1,420,956 | ||
| Calibration 2 | 1,417,512 | ||
| Calibration 3 | 1,421,525 | ||
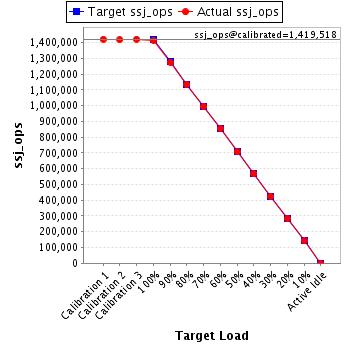
| ssj_ops@calibrated=1,419,518 | |||
| 100% | 99.7% | 1,419,518 | 1,415,709 |
| 90% | 89.8% | 1,277,567 | 1,275,400 |
| 80% | 79.9% | 1,135,615 | 1,134,524 |
| 70% | 70.1% | 993,663 | 995,474 |
| 60% | 60.2% | 851,711 | 854,106 |
| 50% | 49.8% | 709,759 | 706,936 |
| 40% | 39.9% | 567,807 | 566,980 |
| 30% | 30.0% | 425,856 | 425,704 |
| 20% | 19.9% | 283,904 | 282,055 |
| 10% | 10.0% | 141,952 | 141,711 |
| Active Idle | 0 | 0 | |