SPECpower_ssj2008
Copyright © 2007-2019 Standard Performance Evaluation Corporation
| Fujitsu FUJITSU Server PRIMERGY CX2560 M5 | SPECpower_ssj2008 = 10,619 overall ssj_ops/watt | ||||
| Test Sponsor: | Fujitsu | SPEC License #: | 19 | Test Method: | Multi Node |
| Tested By: | Fujitsu | Test Location: | Kawasaki, Kanagawa, Japan | Test Date: | Apr 6, 2019 |
| Hardware Availability: | Jun-2019 | Software Availability: | Dec-2018 | Publication: | May 22, 2019 |
| System Source: | Single Supplier | System Designation: | Server | Power Provisioning: | Line-powered |
| Performance | Power | Performance to Power Ratio | ||
|---|---|---|---|---|
| Target Load | Actual Load | ssj_ops | Average Active Power (W) | |
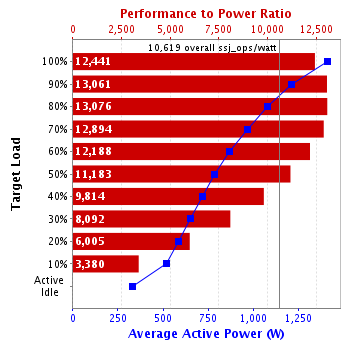
| 100% | 99.7% | 17,566,126 | 1,412 | 12,441 |
| 90% | 90.1% | 15,861,908 | 1,214 | 13,061 |
| 80% | 80.0% | 14,094,424 | 1,078 | 13,076 |
| 70% | 70.9% | 12,493,145 | 969 | 12,894 |
| 60% | 60.0% | 10,566,162 | 867 | 12,188 |
| 50% | 50.0% | 8,798,423 | 787 | 11,183 |
| 40% | 40.0% | 7,042,265 | 718 | 9,814 |
| 30% | 30.0% | 5,279,188 | 652 | 8,092 |
| 20% | 20.0% | 3,523,498 | 587 | 6,005 |
| 10% | 10.0% | 1,758,976 | 520 | 3,380 |
| Active Idle | 0 | 329 | 0 | |
| ∑ssj_ops / ∑power = | 10,619 | |||
| # of Nodes | # of Chips | # of Cores | # of Threads | Total RAM (GB) | # of OS Images | # of JVM Instances |
|---|---|---|---|---|---|---|
| 4 | 8 | 192 | 384 | 768 | 4 | 192 |
| Set Identifier: | CX2560M5 |
| Set Description: | System Under Test |
| # of Identical Nodes: | 4 |
| Comment: | Multi Node |
| Hardware per Node | |
|---|---|
| Hardware Vendor: | Fujitsu |
| Model: | FUJITSU Server PRIMERGY CX2560 M5 |
| Form Factor: | Blade |
| CPU Name: | Intel Xeon Platinum 6252 |
| CPU Characteristics: | 24-Core, 2.10GHz, 35.75MB L3 Cache |
| CPU Frequency (MHz): | 2100 |
| CPU(s) Enabled: | 48 cores, 2 chips, 24 cores/chip |
| Hardware Threads: | 96 (2 / core) |
| CPU(s) Orderable: | 1,2 chips |
| Primary Cache: | 32 KB I + 32 KB D on chip per core |
| Secondary Cache: | 1 MB I+D on chip per core |
| Tertiary Cache: | 36608 KB I+D on chip per chip |
| Other Cache: | None |
| Memory Amount (GB): | 192 |
| # and size of DIMM: | 12 x 16384 MB |
| Memory Details: | 12 x 16 GB 2Rx8 PC4-2933Y-R; slots 1A, 1B, 1C, 1D, 1E, 1F, 1G, 1H, 1J, 1K, 1L, 1M populated |
| Power Supply Quantity and Rating (W): | None |
| Power Supply Details: | N/A |
| Disk Drive: | 1 x SSD M.2 SATA 6Gbps 128GB N H-P, S26361-F5658-L128 |
| Disk Controller: | Integrated SATA Controller |
| # and type of Network Interface Cards (NICs) Installed: | 1 x Intel(R) I210 Gigabit Network Connection (onboard) |
| NICs Enabled in Firmware / OS / Connected: | 1/1/1 |
| Network Speed (Mbit): | 1000 |
| Keyboard: | None |
| Mouse: | None |
| Monitor: | None |
| Optical Drives: | No |
| Other Hardware: | None |
| Software per Node | |
|---|---|
| Power Management: | Enabled (see SUT Notes) |
| Operating System (OS): | SUSE Linux Enterprise Server 12 SP4 |
| OS Version: | 4.12.14-94.41-default |
| Filesystem: | xfs |
| JVM Vendor: | Oracle Corporation |
| JVM Version: | Oracle Java HotSpot(TM) 64-Bit Server VM (build 24.80-b11, mixed mode), version 1.7.0_80 |
| JVM Command-line Options: | server -Xmn1700m -Xms1950m -Xmx1950m -XX:SurvivorRatio=1 -XX:TargetSurvivorRatio=99 -XX:AllocatePrefetchDistance=256 -XX:AllocatePrefetchLines=4 -XX:LoopUnrollLimit=45 -XX:InitialTenuringThreshold=12 -XX:MaxTenuringThreshold=15 -XX:ParallelGCThreads=8 -XX:InlineSmallCode=3900 -XX:MaxInlineSize=270 -XX:FreqInlineSize=2500 -XX:+AggressiveOpts -XX:+UseLargePages -XX:+UseParallelOldGC -XX:+UseHugeTLBFS -XX:+UseTransparentHugePages |
| JVM Affinity: | chrt -r 1 taskset -c [(0,48),(1,49),(2,50),(3,51),(7,55),(8,56),(9,57),(13,61),(14,62),(15,63),(19,67),(20,68),(4,52),(5,53),(6,54),(10,58),(11,59),(12,60),(16,64),(17,65),(18,66),(21,69),(22,70),(23,71),(24,72),(25,73),(26,74),(27,75),(31,79),(32,80),(33,81),(37,85),(38,86),(39,87),(43,91),(44,92),(28,76),(29,77),(30,78),(34,82),(35,83),(36,84),(40,88),(41,89),(42,90),(45,93),(46,94),(47,95)] numactl --membind=[0-3] |
| JVM Instances: | 48 |
| JVM Initial Heap (MB): | 1950 |
| JVM Maximum Heap (MB): | 1950 |
| JVM Address Bits: | 64 |
| Boot Firmware Version: | R1.6.0 |
| Management Firmware Version: | 2.41P |
| Workload Version: | SSJ 1.2.10 |
| Director Location: | Controller |
| Other Software: | None |
| Hardware | |
|---|---|
| Hardware Vendor: | Fujitsu |
| Model: | PRIMERGY RX2530 M2 |
| CPU Description: | Intel Xeon E5-2643 v4 |
| Memory amount (GB): | 64 |
| Software | |
|---|---|
| Operating System (OS): | Microsoft Windows Server 2012 R2 Standard |
| JVM Vendor: | Oracle Corporation |
| JVM Version: | Oracle Java HotSpot(TM) 64-Bit Server VM (build 24.80-b11, mixed mode), version 1.7.0_80 |
| CCS Version: | 1.2.6 |
| Power Analyzer pwr1 | |
|---|---|
| Hardware Vendor: | Hioki |
| Model: | Hioki3336 |
| Serial Number: | 170174584 |
| Connectivity: | RS-232 |
| Input Connection: | Default |
| Metrology Institute: | NICT (National Institute of Information and Communications Technology) |
| Accredited by: | HIOKI E.E. CORPORATION |
| Calibration Label: | H06400087-1901 |
| Date of Calibration: | 30-Jan-2019 |
| PTDaemon Host System: | same as CCS |
| PTDaemon Host OS: | same as CCS |
| PTDaemon Version: | 1.8.1-260d064e-20161220 |
| Setup Description: | Connected to PSU 1 |
| Temperature Sensor temp1 | |
|---|---|
| Hardware Vendor: | Digi International Inc |
| Model: | Watchport/H |
| Driver Version: | Watchport Virtual Port 5.70.105.0 |
| Connectivity: | USB |
| PTDaemon Host System: | same as CCS |
| PTDaemon Host OS: | same as CCS |
| Setup Description: | 5 mm in front of SUT main air intake |
| Target Load | Average Active Power (W) | Minimum Ambient Temperature (°C) |
|---|---|---|
| 100% | 1,412 | 21.1 |
| 90% | 1,214 | 21.1 |
| 80% | 1,078 | 21.2 |
| 70% | 969 | 21.2 |
| 60% | 867 | 21.2 |
| 50% | 787 | 21.1 |
| 40% | 718 | 21.1 |
| 30% | 652 | 21.1 |
| 20% | 587 | 20.9 |
| 10% | 520 | 20.9 |
| Active Idle | 329 | 20.9 |
| Line Standard | Minimum Temperature (°C) | Elevation (m) |
|---|---|---|
| 200V / 50 Hz / 1 phase / 2 wires | 20.9 | 11 |
| Target Load | Actual Load | ssj_ops | |
|---|---|---|---|
| Target | Actual | ||
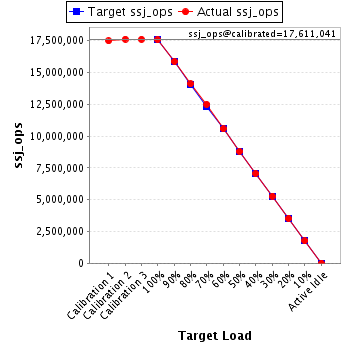
| Calibration 1 | 17,470,634 | ||
| Calibration 2 | 17,613,693 | ||
| Calibration 3 | 17,608,389 | ||
| ssj_ops@calibrated=17,611,041 | |||
| 100% | 99.7% | 17,611,041 | 17,566,126 |
| 90% | 90.1% | 15,849,937 | 15,861,908 |
| 80% | 80.0% | 14,088,833 | 14,094,424 |
| 70% | 70.9% | 12,327,729 | 12,493,145 |
| 60% | 60.0% | 10,566,625 | 10,566,162 |
| 50% | 50.0% | 8,805,521 | 8,798,423 |
| 40% | 40.0% | 7,044,417 | 7,042,265 |
| 30% | 30.0% | 5,283,312 | 5,279,188 |
| 20% | 20.0% | 3,522,208 | 3,523,498 |
| 10% | 10.0% | 1,761,104 | 1,758,976 |
| Active Idle | 0 | 0 | |