SPECpower_ssj2008
Host 'localhost' Performance Report
Copyright © 2007-2019 Standard Performance Evaluation Corporation
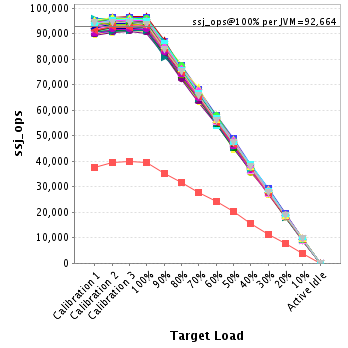
| Fujitsu FUJITSU Server PRIMERGY RX2530 M5 | ssj_ops@100% = 5,189,194 ssj_ops@100% per JVM = 92,664 |
||||
| Test Sponsor: | Fujitsu | SPEC License #: | 19 | Test Method: | Single Node |
| Tested By: | Fujitsu | Test Location: | Kawasaki, Kanagawa, Japan | Test Date: | Apr 9, 2019 |
| Hardware Availability: | Jun-2019 | Software Availability: | Dec-2018 | Publication: | May 22, 2019 |
| System Source: | Single Supplier | System Designation: | Server | Power Provisioning: | Line-powered |
| Target Load | Actual Load | ssj_ops | |
|---|---|---|---|
| Target | Actual | ||
| Calibration 1 | 5,145,381 | ||
| Calibration 2 | 5,194,795 | ||
| Calibration 3 | 5,201,978 | ||
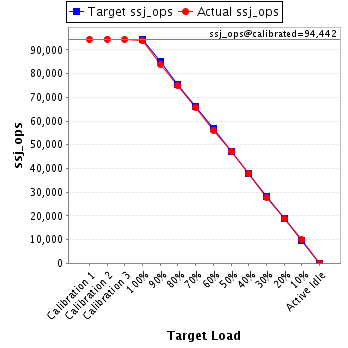
| ssj_ops@calibrated=5,198,386 | |||
| 100% | 99.8% | 5,198,386 | 5,189,194 |
| 90% | 89.9% | 4,678,548 | 4,675,766 |
| 80% | 80.2% | 4,158,709 | 4,168,454 |
| 70% | 70.4% | 3,638,870 | 3,657,993 |
| 60% | 59.9% | 3,119,032 | 3,114,327 |
| 50% | 50.0% | 2,599,193 | 2,598,186 |
| 40% | 40.0% | 2,079,354 | 2,078,598 |
| 30% | 30.0% | 1,559,516 | 1,557,815 |
| 20% | 19.9% | 1,039,677 | 1,035,935 |
| 10% | 10.0% | 519,839 | 520,770 |
| Active Idle | 0 | 0 | |
| Set Identifier: | RX2530M5 |
| Set Description: | System Under Test |
| # of Identical Nodes: | 1 |
| Comment: | Single Node |
| Hardware | |
|---|---|
| Hardware Vendor: | Fujitsu |
| Model: | FUJITSU Server PRIMERGY RX2530 M5 |
| Form Factor: | 2U |
| CPU Name: | Intel Xeon Platinum 8276L |
| CPU Characteristics: | 28-Core, 2.20GHz, 38.5MB L3 Cache |
| CPU Frequency (MHz): | 2200 |
| CPU(s) Enabled: | 56 cores, 2 chips, 28 cores/chip |
| Hardware Threads: | 112 (2 / core) |
| CPU(s) Orderable: | 1,2 chips |
| Primary Cache: | 32 KB I + 32 KB D on chip per core |
| Secondary Cache: | 1 MB I+D on chip per core |
| Tertiary Cache: | 39424 KB I+D on chip per chip |
| Other Cache: | None |
| Memory Amount (GB): | 192 |
| # and size of DIMM: | 12 x 16384 MB |
| Memory Details: | 12 x 16 GB 2Rx8 PC4-2933Y-R; slots 1A, 1B, 1C, 1D, 1E, 1F, 1G, 1H, 1J, 1K, 1L, 1M populated |
| Power Supply Quantity and Rating (W): | 1 x 800 |
| Power Supply Details: | Fujitsu Technology Solutions S26113-F615-E10 |
| Disk Drive: | 1 x SSD M. 240GB, S26361-F5706-E240 |
| Disk Controller: | Integrated SATA Controller |
| # and type of Network Interface Cards (NICs) Installed: | 2 x Intel(R) I350 Gigabit Network Connection (onboard) |
| NICs Enabled in Firmware / OS / Connected: | 1/1/1 |
| Network Speed (Mbit): | 1000 |
| Keyboard: | None |
| Mouse: | None |
| Monitor: | None |
| Optical Drives: | No |
| Other Hardware: | None |
| Software | |
|---|---|
| Power Management: | Enabled (see SUT Notes) |
| Operating System (OS): | SUSE Linux Enterprise Server 12 SP4 |
| OS Version: | 4.12.14-94.41-default |
| Filesystem: | xfs |
| JVM Vendor: | Oracle Corporation |
| JVM Version: | Oracle Java HotSpot(TM) 64-Bit Server VM (build 24.80-b11, mixed mode), version 1.7.0_80 |
| JVM Command-line Options: | -server -Xmn1700m -Xms1950m -Xmx1950m -XX:SurvivorRatio=1 -XX:TargetSurvivorRatio=99 -XX:AllocatePrefetchDistance=256 -XX:AllocatePrefetchLines=4 -XX:LoopUnrollLimit=45 -XX:InitialTenuringThreshold=12 -XX:MaxTenuringThreshold=15 -XX:ParallelGCThreads=8 -XX:InlineSmallCode=3900 -XX:MaxInlineSize=270 -XX:FreqInlineSize=2500 -XX:+AggressiveOpts -XX:+UseLargePages -XX:+UseParallelOldGC |
| JVM Affinity: | chrt -r 1 taskset -c [(0,56),(1,57),(2,58),(3,59),(7,63),(8,64),(9,65),(14,70),(15,71),(16,72),(17,73),(21,77),(22,78),(23,79),(4,60),(5,61),(6,62),(10,66),(11,67),(12,68),(13,69),(18,74),(19,75),(20,76),(24,80),(25,81),(26,82),(27,83),(28,84),(29,85),(30,86),(31,87),(35,91),(36,92),(37,93),(42,98),(43,99),(44,100),(45,101),(49,105),(50,106),(51,107),(32,88),(33,89),(34,90),(38,94),(39,95),(40,96),(41,97),(46,102),(47,103),(48,104),(52,108),(53,109),(54,110),(55,111)] numactl --membind=[0-3] |
| JVM Instances: | 56 |
| JVM Initial Heap (MB): | 1950 |
| JVM Maximum Heap (MB): | 1950 |
| JVM Address Bits: | 64 |
| Boot Firmware Version: | R1.8.0 |
| Management Firmware Version: | 2.00c |
| Workload Version: | SSJ 1.2.10 |
| Director Location: | Controller |
| Other Software: | None |
| Target Load | Actual Load | ssj_ops | |
|---|---|---|---|
| Target | Actual | ||
| Calibration 1 | 37,688 | ||
| Calibration 2 | 39,502 | ||
| Calibration 3 | 39,986 | ||
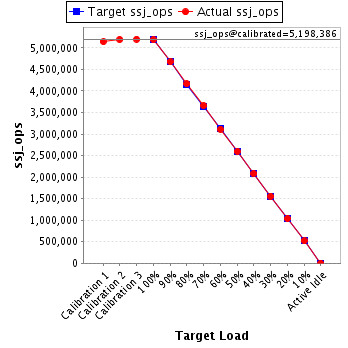
| ssj_ops@calibrated=39,744 | |||
| 100% | 99.4% | 39,744 | 39,500 |
| 90% | 89.0% | 35,770 | 35,378 |
| 80% | 79.6% | 31,795 | 31,622 |
| 70% | 69.8% | 27,821 | 27,724 |
| 60% | 60.8% | 23,846 | 24,150 |
| 50% | 50.9% | 19,872 | 20,221 |
| 40% | 39.6% | 15,898 | 15,737 |
| 30% | 28.7% | 11,923 | 11,425 |
| 20% | 19.5% | 7,949 | 7,745 |
| 10% | 10.0% | 3,974 | 3,979 |
| Active Idle | 0 | 0 | |

| Target Load | Actual Load | ssj_ops | |
|---|---|---|---|
| Target | Actual | ||
| Calibration 1 | 90,390 | ||
| Calibration 2 | 90,591 | ||
| Calibration 3 | 91,307 | ||
| ssj_ops@calibrated=90,949 | |||
| 100% | 99.8% | 90,949 | 90,757 |
| 90% | 89.8% | 81,854 | 81,696 |
| 80% | 80.1% | 72,759 | 72,853 |
| 70% | 70.4% | 63,664 | 63,984 |
| 60% | 60.0% | 54,570 | 54,529 |
| 50% | 50.0% | 45,475 | 45,472 |
| 40% | 39.8% | 36,380 | 36,192 |
| 30% | 30.3% | 27,285 | 27,587 |
| 20% | 19.9% | 18,190 | 18,083 |
| 10% | 10.0% | 9,095 | 9,075 |
| Active Idle | 0 | 0 | |
| Target Load | Actual Load | ssj_ops | |
|---|---|---|---|
| Target | Actual | ||
| Calibration 1 | 93,998 | ||
| Calibration 2 | 94,720 | ||
| Calibration 3 | 95,048 | ||
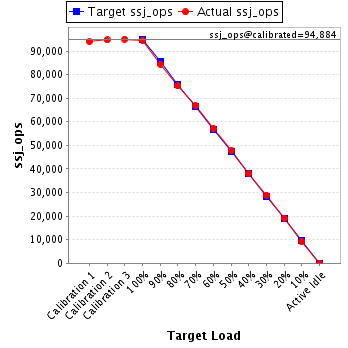
| ssj_ops@calibrated=94,884 | |||
| 100% | 99.6% | 94,884 | 94,473 |
| 90% | 89.0% | 85,396 | 84,434 |
| 80% | 79.3% | 75,907 | 75,203 |
| 70% | 70.4% | 66,419 | 66,796 |
| 60% | 60.2% | 56,930 | 57,089 |
| 50% | 50.3% | 47,442 | 47,707 |
| 40% | 40.1% | 37,954 | 38,084 |
| 30% | 30.4% | 28,465 | 28,841 |
| 20% | 20.1% | 18,977 | 19,081 |
| 10% | 9.7% | 9,488 | 9,217 |
| Active Idle | 0 | 0 | |
| Target Load | Actual Load | ssj_ops | |
|---|---|---|---|
| Target | Actual | ||
| Calibration 1 | 95,122 | ||
| Calibration 2 | 94,500 | ||
| Calibration 3 | 94,787 | ||
| ssj_ops@calibrated=94,644 | |||
| 100% | 100.1% | 94,644 | 94,705 |
| 90% | 90.3% | 85,179 | 85,445 |
| 80% | 79.0% | 75,715 | 74,780 |
| 70% | 69.6% | 66,251 | 65,901 |
| 60% | 60.5% | 56,786 | 57,258 |
| 50% | 50.2% | 47,322 | 47,526 |
| 40% | 39.9% | 37,857 | 37,807 |
| 30% | 30.3% | 28,393 | 28,701 |
| 20% | 19.7% | 18,929 | 18,633 |
| 10% | 9.9% | 9,464 | 9,400 |
| Active Idle | 0 | 0 | |

| Target Load | Actual Load | ssj_ops | |
|---|---|---|---|
| Target | Actual | ||
| Calibration 1 | 92,066 | ||
| Calibration 2 | 92,881 | ||
| Calibration 3 | 92,835 | ||
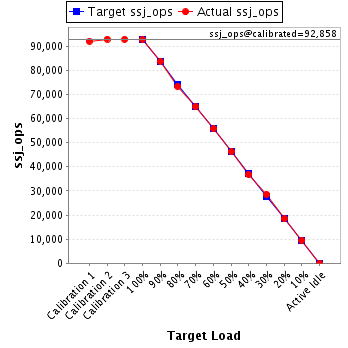
| ssj_ops@calibrated=92,858 | |||
| 100% | 99.9% | 92,858 | 92,740 |
| 90% | 90.1% | 83,572 | 83,696 |
| 80% | 79.0% | 74,286 | 73,336 |
| 70% | 69.9% | 65,001 | 64,887 |
| 60% | 60.0% | 55,715 | 55,722 |
| 50% | 49.7% | 46,429 | 46,184 |
| 40% | 39.6% | 37,143 | 36,767 |
| 30% | 30.8% | 27,857 | 28,623 |
| 20% | 19.8% | 18,572 | 18,402 |
| 10% | 10.2% | 9,286 | 9,432 |
| Active Idle | 0 | 0 | |
| Target Load | Actual Load | ssj_ops | |
|---|---|---|---|
| Target | Actual | ||
| Calibration 1 | 90,702 | ||
| Calibration 2 | 93,155 | ||
| Calibration 3 | 93,769 | ||
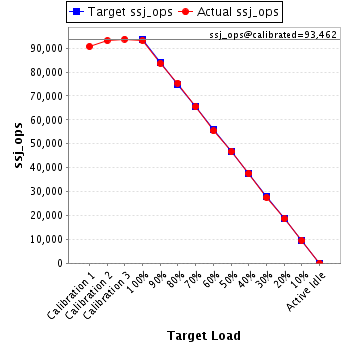
| ssj_ops@calibrated=93,462 | |||
| 100% | 99.8% | 93,462 | 93,230 |
| 90% | 89.4% | 84,116 | 83,572 |
| 80% | 80.6% | 74,770 | 75,377 |
| 70% | 70.1% | 65,423 | 65,509 |
| 60% | 59.3% | 56,077 | 55,420 |
| 50% | 50.0% | 46,731 | 46,734 |
| 40% | 40.2% | 37,385 | 37,576 |
| 30% | 29.4% | 28,039 | 27,520 |
| 20% | 19.9% | 18,692 | 18,577 |
| 10% | 10.2% | 9,346 | 9,496 |
| Active Idle | 0 | 0 | |
| Target Load | Actual Load | ssj_ops | |
|---|---|---|---|
| Target | Actual | ||
| Calibration 1 | 92,559 | ||
| Calibration 2 | 93,799 | ||
| Calibration 3 | 93,984 | ||
| ssj_ops@calibrated=93,891 | |||
| 100% | 99.8% | 93,891 | 93,731 |
| 90% | 89.8% | 84,502 | 84,287 |
| 80% | 80.9% | 75,113 | 75,950 |
| 70% | 71.1% | 65,724 | 66,722 |
| 60% | 60.0% | 56,335 | 56,381 |
| 50% | 50.7% | 46,946 | 47,601 |
| 40% | 40.1% | 37,557 | 37,627 |
| 30% | 30.9% | 28,167 | 28,992 |
| 20% | 20.2% | 18,778 | 18,987 |
| 10% | 10.2% | 9,389 | 9,587 |
| Active Idle | 0 | 0 | |

| Target Load | Actual Load | ssj_ops | |
|---|---|---|---|
| Target | Actual | ||
| Calibration 1 | 93,121 | ||
| Calibration 2 | 93,944 | ||
| Calibration 3 | 94,445 | ||
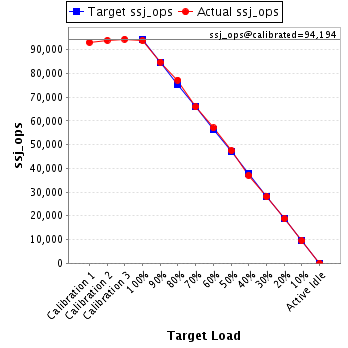
| ssj_ops@calibrated=94,194 | |||
| 100% | 99.6% | 94,194 | 93,847 |
| 90% | 90.0% | 84,775 | 84,814 |
| 80% | 81.9% | 75,355 | 77,185 |
| 70% | 70.0% | 65,936 | 65,918 |
| 60% | 60.5% | 56,517 | 57,024 |
| 50% | 50.5% | 47,097 | 47,532 |
| 40% | 39.3% | 37,678 | 37,021 |
| 30% | 29.8% | 28,258 | 28,028 |
| 20% | 19.9% | 18,839 | 18,752 |
| 10% | 10.1% | 9,419 | 9,500 |
| Active Idle | 0 | 0 | |
| Target Load | Actual Load | ssj_ops | |
|---|---|---|---|
| Target | Actual | ||
| Calibration 1 | 94,122 | ||
| Calibration 2 | 94,699 | ||
| Calibration 3 | 95,063 | ||
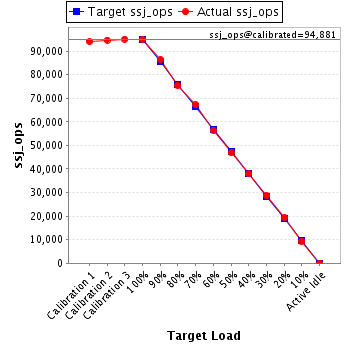
| ssj_ops@calibrated=94,881 | |||
| 100% | 99.9% | 94,881 | 94,816 |
| 90% | 91.0% | 85,393 | 86,371 |
| 80% | 79.5% | 75,905 | 75,458 |
| 70% | 70.9% | 66,417 | 67,291 |
| 60% | 59.5% | 56,929 | 56,452 |
| 50% | 49.3% | 47,441 | 46,801 |
| 40% | 39.9% | 37,952 | 37,886 |
| 30% | 30.1% | 28,464 | 28,565 |
| 20% | 20.4% | 18,976 | 19,361 |
| 10% | 9.9% | 9,488 | 9,396 |
| Active Idle | 0 | 0 | |
| Target Load | Actual Load | ssj_ops | |
|---|---|---|---|
| Target | Actual | ||
| Calibration 1 | 91,907 | ||
| Calibration 2 | 93,628 | ||
| Calibration 3 | 94,213 | ||
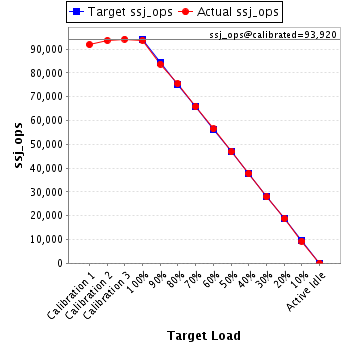
| ssj_ops@calibrated=93,920 | |||
| 100% | 99.8% | 93,920 | 93,734 |
| 90% | 89.1% | 84,528 | 83,725 |
| 80% | 80.4% | 75,136 | 75,501 |
| 70% | 70.2% | 65,744 | 65,935 |
| 60% | 60.1% | 56,352 | 56,465 |
| 50% | 49.9% | 46,960 | 46,891 |
| 40% | 40.2% | 37,568 | 37,735 |
| 30% | 29.7% | 28,176 | 27,868 |
| 20% | 20.0% | 18,784 | 18,767 |
| 10% | 9.9% | 9,392 | 9,264 |
| Active Idle | 0 | 0 | |
| Target Load | Actual Load | ssj_ops | |
|---|---|---|---|
| Target | Actual | ||
| Calibration 1 | 92,680 | ||
| Calibration 2 | 94,399 | ||
| Calibration 3 | 94,614 | ||
| ssj_ops@calibrated=94,506 | |||
| 100% | 99.4% | 94,506 | 93,910 |
| 90% | 90.6% | 85,056 | 85,643 |
| 80% | 80.0% | 75,605 | 75,599 |
| 70% | 71.2% | 66,154 | 67,270 |
| 60% | 59.9% | 56,704 | 56,600 |
| 50% | 49.5% | 47,253 | 46,734 |
| 40% | 39.7% | 37,803 | 37,490 |
| 30% | 29.9% | 28,352 | 28,270 |
| 20% | 20.1% | 18,901 | 18,949 |
| 10% | 10.4% | 9,451 | 9,871 |
| Active Idle | 0 | 0 | |

| Target Load | Actual Load | ssj_ops | |
|---|---|---|---|
| Target | Actual | ||
| Calibration 1 | 92,235 | ||
| Calibration 2 | 91,761 | ||
| Calibration 3 | 91,937 | ||
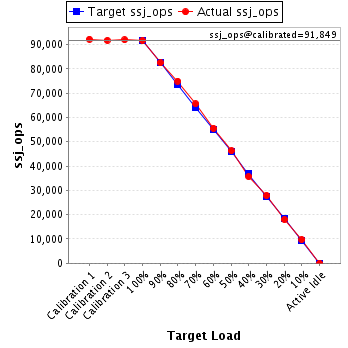
| ssj_ops@calibrated=91,849 | |||
| 100% | 99.8% | 91,849 | 91,642 |
| 90% | 89.8% | 82,664 | 82,505 |
| 80% | 81.6% | 73,479 | 74,954 |
| 70% | 71.4% | 64,294 | 65,598 |
| 60% | 60.5% | 55,109 | 55,574 |
| 50% | 50.4% | 45,925 | 46,297 |
| 40% | 38.8% | 36,740 | 35,664 |
| 30% | 30.3% | 27,555 | 27,871 |
| 20% | 19.5% | 18,370 | 17,946 |
| 10% | 10.6% | 9,185 | 9,776 |
| Active Idle | 0 | 0 | |
| Target Load | Actual Load | ssj_ops | |
|---|---|---|---|
| Target | Actual | ||
| Calibration 1 | 92,949 | ||
| Calibration 2 | 94,130 | ||
| Calibration 3 | 94,312 | ||
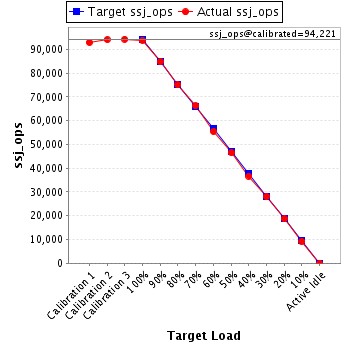
| ssj_ops@calibrated=94,221 | |||
| 100% | 99.6% | 94,221 | 93,868 |
| 90% | 90.0% | 84,799 | 84,781 |
| 80% | 79.6% | 75,377 | 75,043 |
| 70% | 70.3% | 65,955 | 66,217 |
| 60% | 58.9% | 56,533 | 55,486 |
| 50% | 49.4% | 47,110 | 46,501 |
| 40% | 38.9% | 37,688 | 36,690 |
| 30% | 29.8% | 28,266 | 28,052 |
| 20% | 19.8% | 18,844 | 18,650 |
| 10% | 9.8% | 9,422 | 9,225 |
| Active Idle | 0 | 0 | |
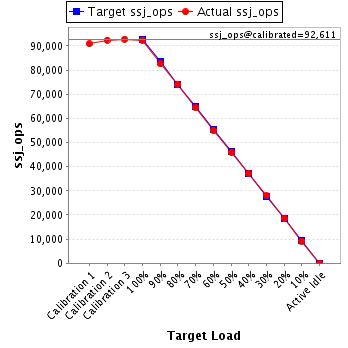
| Target Load | Actual Load | ssj_ops | |
|---|---|---|---|
| Target | Actual | ||
| Calibration 1 | 90,857 | ||
| Calibration 2 | 92,422 | ||
| Calibration 3 | 92,801 | ||
| ssj_ops@calibrated=92,611 | |||
| 100% | 99.8% | 92,611 | 92,399 |
| 90% | 89.2% | 83,350 | 82,578 |
| 80% | 80.1% | 74,089 | 74,169 |
| 70% | 69.5% | 64,828 | 64,343 |
| 60% | 59.4% | 55,567 | 54,993 |
| 50% | 49.6% | 46,306 | 45,941 |
| 40% | 40.0% | 37,044 | 37,090 |
| 30% | 30.2% | 27,783 | 27,994 |
| 20% | 20.1% | 18,522 | 18,608 |
| 10% | 9.9% | 9,261 | 9,183 |
| Active Idle | 0 | 0 | |
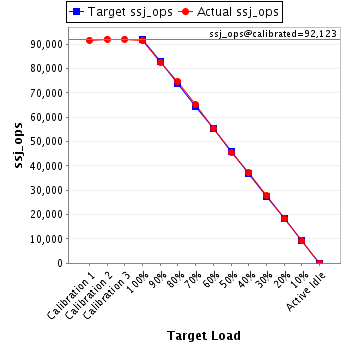
| Target Load | Actual Load | ssj_ops | |
|---|---|---|---|
| Target | Actual | ||
| Calibration 1 | 91,730 | ||
| Calibration 2 | 92,118 | ||
| Calibration 3 | 92,127 | ||
| ssj_ops@calibrated=92,123 | |||
| 100% | 99.3% | 92,123 | 91,471 |
| 90% | 89.7% | 82,910 | 82,637 |
| 80% | 81.1% | 73,698 | 74,669 |
| 70% | 70.9% | 64,486 | 65,331 |
| 60% | 60.1% | 55,274 | 55,395 |
| 50% | 49.5% | 46,061 | 45,611 |
| 40% | 40.3% | 36,849 | 37,159 |
| 30% | 30.1% | 27,637 | 27,728 |
| 20% | 19.8% | 18,425 | 18,212 |
| 10% | 10.0% | 9,212 | 9,185 |
| Active Idle | 0 | 0 | |
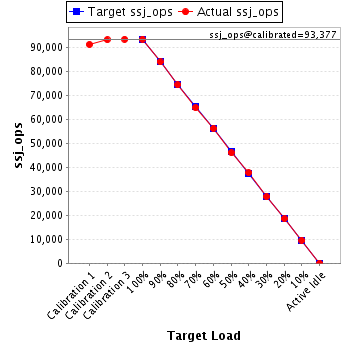
| Target Load | Actual Load | ssj_ops | |
|---|---|---|---|
| Target | Actual | ||
| Calibration 1 | 91,302 | ||
| Calibration 2 | 93,275 | ||
| Calibration 3 | 93,478 | ||
| ssj_ops@calibrated=93,377 | |||
| 100% | 100.1% | 93,377 | 93,508 |
| 90% | 89.9% | 84,039 | 83,986 |
| 80% | 79.7% | 74,701 | 74,420 |
| 70% | 69.5% | 65,364 | 64,907 |
| 60% | 60.3% | 56,026 | 56,283 |
| 50% | 49.4% | 46,688 | 46,139 |
| 40% | 40.4% | 37,351 | 37,733 |
| 30% | 29.7% | 28,013 | 27,746 |
| 20% | 19.9% | 18,675 | 18,583 |
| 10% | 10.2% | 9,338 | 9,550 |
| Active Idle | 0 | 0 | |
| Target Load | Actual Load | ssj_ops | |
|---|---|---|---|
| Target | Actual | ||
| Calibration 1 | 91,696 | ||
| Calibration 2 | 92,352 | ||
| Calibration 3 | 92,564 | ||
| ssj_ops@calibrated=92,458 | |||
| 100% | 100.0% | 92,458 | 92,475 |
| 90% | 88.6% | 83,212 | 81,918 |
| 80% | 80.4% | 73,966 | 74,327 |
| 70% | 71.6% | 64,720 | 66,223 |
| 60% | 59.0% | 55,475 | 54,564 |
| 50% | 50.1% | 46,229 | 46,366 |
| 40% | 40.5% | 36,983 | 37,451 |
| 30% | 30.2% | 27,737 | 27,896 |
| 20% | 20.0% | 18,492 | 18,468 |
| 10% | 9.7% | 9,246 | 8,954 |
| Active Idle | 0 | 0 | |

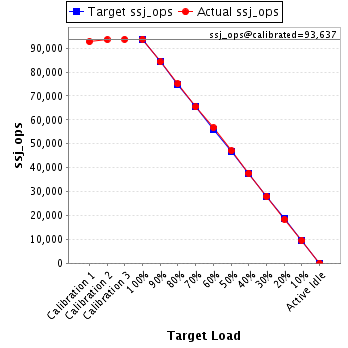
| Target Load | Actual Load | ssj_ops | |
|---|---|---|---|
| Target | Actual | ||
| Calibration 1 | 92,748 | ||
| Calibration 2 | 93,591 | ||
| Calibration 3 | 93,682 | ||
| ssj_ops@calibrated=93,637 | |||
| 100% | 100.2% | 93,637 | 93,782 |
| 90% | 90.0% | 84,273 | 84,264 |
| 80% | 80.2% | 74,909 | 75,136 |
| 70% | 69.9% | 65,546 | 65,447 |
| 60% | 60.6% | 56,182 | 56,720 |
| 50% | 50.3% | 46,818 | 47,077 |
| 40% | 40.2% | 37,455 | 37,652 |
| 30% | 29.8% | 28,091 | 27,916 |
| 20% | 19.6% | 18,727 | 18,392 |
| 10% | 10.2% | 9,364 | 9,515 |
| Active Idle | 0 | 0 | |
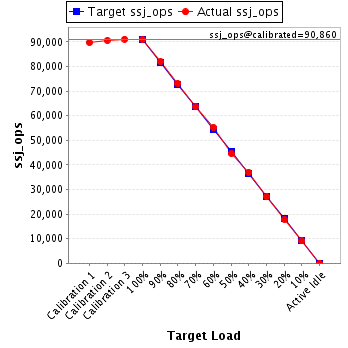
| Target Load | Actual Load | ssj_ops | |
|---|---|---|---|
| Target | Actual | ||
| Calibration 1 | 89,762 | ||
| Calibration 2 | 90,601 | ||
| Calibration 3 | 91,118 | ||
| ssj_ops@calibrated=90,860 | |||
| 100% | 100.2% | 90,860 | 91,012 |
| 90% | 90.2% | 81,774 | 81,955 |
| 80% | 80.5% | 72,688 | 73,157 |
| 70% | 69.9% | 63,602 | 63,553 |
| 60% | 60.8% | 54,516 | 55,257 |
| 50% | 49.1% | 45,430 | 44,599 |
| 40% | 40.7% | 36,344 | 36,967 |
| 30% | 29.8% | 27,258 | 27,051 |
| 20% | 19.7% | 18,172 | 17,881 |
| 10% | 10.0% | 9,086 | 9,075 |
| Active Idle | 0 | 0 | |
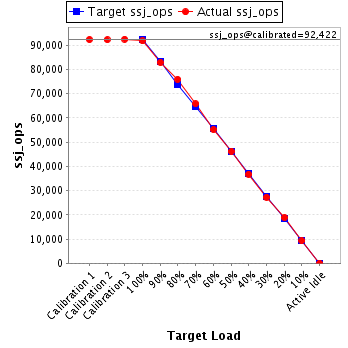
| Target Load | Actual Load | ssj_ops | |
|---|---|---|---|
| Target | Actual | ||
| Calibration 1 | 92,373 | ||
| Calibration 2 | 92,290 | ||
| Calibration 3 | 92,553 | ||
| ssj_ops@calibrated=92,422 | |||
| 100% | 99.4% | 92,422 | 91,821 |
| 90% | 89.7% | 83,180 | 82,936 |
| 80% | 82.2% | 73,937 | 75,949 |
| 70% | 71.3% | 64,695 | 65,853 |
| 60% | 59.7% | 55,453 | 55,200 |
| 50% | 50.0% | 46,211 | 46,200 |
| 40% | 39.8% | 36,969 | 36,794 |
| 30% | 29.6% | 27,727 | 27,338 |
| 20% | 20.4% | 18,484 | 18,842 |
| 10% | 10.1% | 9,242 | 9,300 |
| Active Idle | 0 | 0 | |
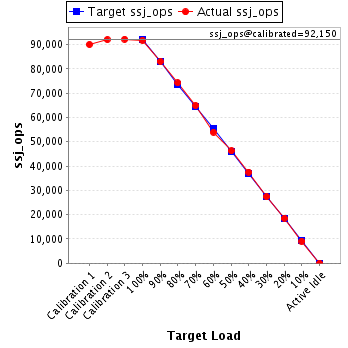
| Target Load | Actual Load | ssj_ops | |
|---|---|---|---|
| Target | Actual | ||
| Calibration 1 | 90,048 | ||
| Calibration 2 | 92,064 | ||
| Calibration 3 | 92,235 | ||
| ssj_ops@calibrated=92,150 | |||
| 100% | 99.6% | 92,150 | 91,796 |
| 90% | 90.1% | 82,935 | 83,037 |
| 80% | 80.6% | 73,720 | 74,235 |
| 70% | 70.5% | 64,505 | 64,924 |
| 60% | 58.6% | 55,290 | 53,957 |
| 50% | 50.2% | 46,075 | 46,274 |
| 40% | 40.7% | 36,860 | 37,550 |
| 30% | 29.7% | 27,645 | 27,358 |
| 20% | 20.1% | 18,430 | 18,559 |
| 10% | 9.8% | 9,215 | 9,062 |
| Active Idle | 0 | 0 | |
| Target Load | Actual Load | ssj_ops | |
|---|---|---|---|
| Target | Actual | ||
| Calibration 1 | 90,025 | ||
| Calibration 2 | 91,533 | ||
| Calibration 3 | 91,702 | ||
| ssj_ops@calibrated=91,618 | |||
| 100% | 99.6% | 91,618 | 91,263 |
| 90% | 90.8% | 82,456 | 83,144 |
| 80% | 80.3% | 73,294 | 73,596 |
| 70% | 70.6% | 64,132 | 64,658 |
| 60% | 60.9% | 54,971 | 55,790 |
| 50% | 50.6% | 45,809 | 46,371 |
| 40% | 40.1% | 36,647 | 36,725 |
| 30% | 30.3% | 27,485 | 27,719 |
| 20% | 19.8% | 18,324 | 18,100 |
| 10% | 9.9% | 9,162 | 9,079 |
| Active Idle | 0 | 0 | |

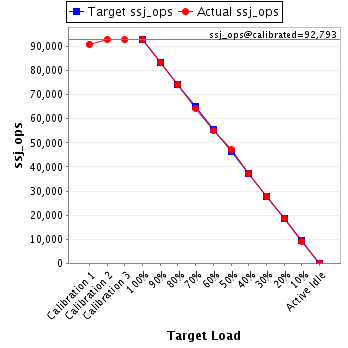
| Target Load | Actual Load | ssj_ops | |
|---|---|---|---|
| Target | Actual | ||
| Calibration 1 | 90,942 | ||
| Calibration 2 | 92,880 | ||
| Calibration 3 | 92,705 | ||
| ssj_ops@calibrated=92,793 | |||
| 100% | 100.3% | 92,793 | 93,037 |
| 90% | 89.9% | 83,514 | 83,459 |
| 80% | 79.9% | 74,234 | 74,114 |
| 70% | 69.4% | 64,955 | 64,401 |
| 60% | 59.3% | 55,676 | 54,989 |
| 50% | 50.7% | 46,396 | 47,024 |
| 40% | 40.3% | 37,117 | 37,359 |
| 30% | 30.0% | 27,838 | 27,880 |
| 20% | 20.1% | 18,559 | 18,642 |
| 10% | 9.9% | 9,279 | 9,221 |
| Active Idle | 0 | 0 | |
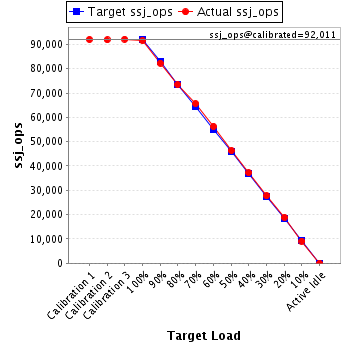
| Target Load | Actual Load | ssj_ops | |
|---|---|---|---|
| Target | Actual | ||
| Calibration 1 | 92,019 | ||
| Calibration 2 | 91,876 | ||
| Calibration 3 | 92,145 | ||
| ssj_ops@calibrated=92,011 | |||
| 100% | 99.5% | 92,011 | 91,523 |
| 90% | 89.4% | 82,809 | 82,275 |
| 80% | 79.9% | 73,608 | 73,475 |
| 70% | 71.3% | 64,407 | 65,640 |
| 60% | 61.2% | 55,206 | 56,347 |
| 50% | 50.4% | 46,005 | 46,377 |
| 40% | 40.4% | 36,804 | 37,184 |
| 30% | 30.1% | 27,603 | 27,687 |
| 20% | 20.5% | 18,402 | 18,889 |
| 10% | 9.9% | 9,201 | 9,079 |
| Active Idle | 0 | 0 | |
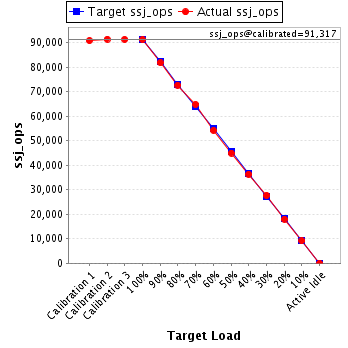
| Target Load | Actual Load | ssj_ops | |
|---|---|---|---|
| Target | Actual | ||
| Calibration 1 | 90,754 | ||
| Calibration 2 | 91,350 | ||
| Calibration 3 | 91,285 | ||
| ssj_ops@calibrated=91,317 | |||
| 100% | 99.9% | 91,317 | 91,184 |
| 90% | 89.5% | 82,185 | 81,722 |
| 80% | 79.5% | 73,054 | 72,624 |
| 70% | 70.9% | 63,922 | 64,770 |
| 60% | 59.4% | 54,790 | 54,246 |
| 50% | 49.2% | 45,659 | 44,939 |
| 40% | 39.8% | 36,527 | 36,359 |
| 30% | 30.3% | 27,395 | 27,667 |
| 20% | 19.7% | 18,263 | 17,999 |
| 10% | 10.0% | 9,132 | 9,158 |
| Active Idle | 0 | 0 | |
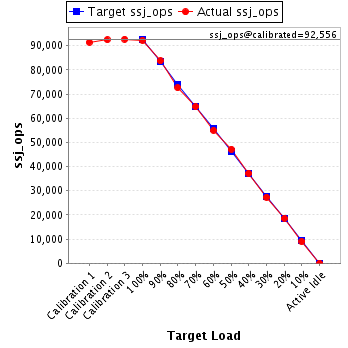
| Target Load | Actual Load | ssj_ops | |
|---|---|---|---|
| Target | Actual | ||
| Calibration 1 | 91,464 | ||
| Calibration 2 | 92,427 | ||
| Calibration 3 | 92,686 | ||
| ssj_ops@calibrated=92,556 | |||
| 100% | 99.7% | 92,556 | 92,258 |
| 90% | 90.4% | 83,301 | 83,690 |
| 80% | 78.5% | 74,045 | 72,615 |
| 70% | 70.0% | 64,789 | 64,805 |
| 60% | 59.4% | 55,534 | 55,024 |
| 50% | 50.9% | 46,278 | 47,136 |
| 40% | 40.2% | 37,022 | 37,185 |
| 30% | 29.6% | 27,767 | 27,373 |
| 20% | 20.1% | 18,511 | 18,593 |
| 10% | 9.7% | 9,256 | 9,022 |
| Active Idle | 0 | 0 | |
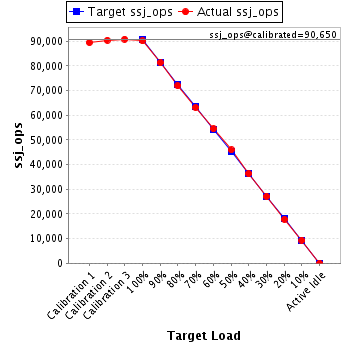
| Target Load | Actual Load | ssj_ops | |
|---|---|---|---|
| Target | Actual | ||
| Calibration 1 | 89,456 | ||
| Calibration 2 | 90,433 | ||
| Calibration 3 | 90,866 | ||
| ssj_ops@calibrated=90,650 | |||
| 100% | 99.4% | 90,650 | 90,128 |
| 90% | 89.8% | 81,585 | 81,360 |
| 80% | 79.4% | 72,520 | 71,969 |
| 70% | 69.6% | 63,455 | 63,134 |
| 60% | 60.1% | 54,390 | 54,497 |
| 50% | 50.7% | 45,325 | 45,957 |
| 40% | 40.1% | 36,260 | 36,321 |
| 30% | 30.0% | 27,195 | 27,155 |
| 20% | 19.6% | 18,130 | 17,812 |
| 10% | 10.3% | 9,065 | 9,329 |
| Active Idle | 0 | 0 | |
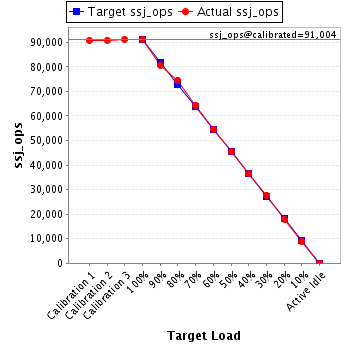
| Target Load | Actual Load | ssj_ops | |
|---|---|---|---|
| Target | Actual | ||
| Calibration 1 | 90,848 | ||
| Calibration 2 | 90,848 | ||
| Calibration 3 | 91,160 | ||
| ssj_ops@calibrated=91,004 | |||
| 100% | 100.3% | 91,004 | 91,270 |
| 90% | 88.7% | 81,904 | 80,681 |
| 80% | 82.0% | 72,803 | 74,626 |
| 70% | 70.8% | 63,703 | 64,427 |
| 60% | 60.0% | 54,603 | 54,622 |
| 50% | 49.8% | 45,502 | 45,354 |
| 40% | 40.0% | 36,402 | 36,367 |
| 30% | 30.4% | 27,301 | 27,624 |
| 20% | 19.8% | 18,201 | 18,025 |
| 10% | 9.8% | 9,100 | 8,896 |
| Active Idle | 0 | 0 | |
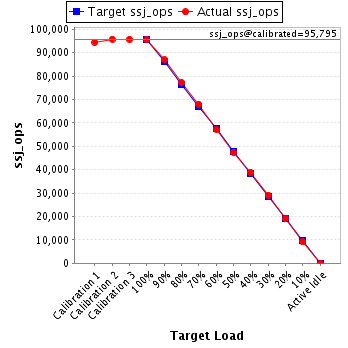
| Target Load | Actual Load | ssj_ops | |
|---|---|---|---|
| Target | Actual | ||
| Calibration 1 | 94,523 | ||
| Calibration 2 | 95,802 | ||
| Calibration 3 | 95,787 | ||
| ssj_ops@calibrated=95,795 | |||
| 100% | 99.8% | 95,795 | 95,586 |
| 90% | 90.8% | 86,215 | 87,016 |
| 80% | 80.7% | 76,636 | 77,299 |
| 70% | 71.0% | 67,056 | 68,041 |
| 60% | 59.8% | 57,477 | 57,310 |
| 50% | 49.5% | 47,897 | 47,417 |
| 40% | 40.5% | 38,318 | 38,817 |
| 30% | 30.3% | 28,738 | 29,067 |
| 20% | 19.9% | 19,159 | 19,075 |
| 10% | 9.6% | 9,579 | 9,212 |
| Active Idle | 0 | 0 | |
| Target Load | Actual Load | ssj_ops | |
|---|---|---|---|
| Target | Actual | ||
| Calibration 1 | 94,759 | ||
| Calibration 2 | 94,505 | ||
| Calibration 3 | 94,641 | ||
| ssj_ops@calibrated=94,573 | |||
| 100% | 99.4% | 94,573 | 94,034 |
| 90% | 90.0% | 85,116 | 85,139 |
| 80% | 80.8% | 75,659 | 76,441 |
| 70% | 70.1% | 66,201 | 66,304 |
| 60% | 59.6% | 56,744 | 56,376 |
| 50% | 49.9% | 47,287 | 47,187 |
| 40% | 39.8% | 37,829 | 37,675 |
| 30% | 30.4% | 28,372 | 28,737 |
| 20% | 20.0% | 18,915 | 18,933 |
| 10% | 10.1% | 9,457 | 9,568 |
| Active Idle | 0 | 0 | |

| Target Load | Actual Load | ssj_ops | |
|---|---|---|---|
| Target | Actual | ||
| Calibration 1 | 94,747 | ||
| Calibration 2 | 94,763 | ||
| Calibration 3 | 94,335 | ||
| ssj_ops@calibrated=94,549 | |||
| 100% | 99.6% | 94,549 | 94,134 |
| 90% | 90.3% | 85,094 | 85,411 |
| 80% | 79.2% | 75,639 | 74,915 |
| 70% | 70.3% | 66,184 | 66,424 |
| 60% | 59.6% | 56,729 | 56,316 |
| 50% | 50.2% | 47,275 | 47,421 |
| 40% | 40.7% | 37,820 | 38,528 |
| 30% | 29.7% | 28,365 | 28,114 |
| 20% | 20.2% | 18,910 | 19,092 |
| 10% | 10.0% | 9,455 | 9,417 |
| Active Idle | 0 | 0 | |

| Target Load | Actual Load | ssj_ops | |
|---|---|---|---|
| Target | Actual | ||
| Calibration 1 | 93,489 | ||
| Calibration 2 | 94,640 | ||
| Calibration 3 | 94,929 | ||
| ssj_ops@calibrated=94,785 | |||
| 100% | 99.5% | 94,785 | 94,345 |
| 90% | 90.5% | 85,306 | 85,764 |
| 80% | 81.7% | 75,828 | 77,471 |
| 70% | 70.0% | 66,349 | 66,375 |
| 60% | 59.0% | 56,871 | 55,939 |
| 50% | 50.3% | 47,392 | 47,646 |
| 40% | 40.5% | 37,914 | 38,395 |
| 30% | 30.0% | 28,435 | 28,412 |
| 20% | 20.6% | 18,957 | 19,556 |
| 10% | 10.1% | 9,478 | 9,537 |
| Active Idle | 0 | 0 | |

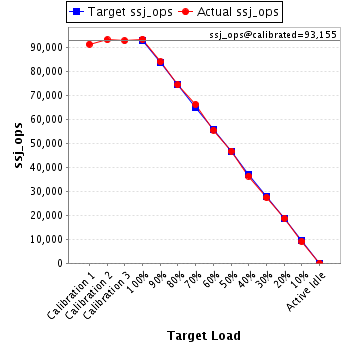
| Target Load | Actual Load | ssj_ops | |
|---|---|---|---|
| Target | Actual | ||
| Calibration 1 | 91,529 | ||
| Calibration 2 | 93,342 | ||
| Calibration 3 | 92,969 | ||
| ssj_ops@calibrated=93,155 | |||
| 100% | 100.5% | 93,155 | 93,606 |
| 90% | 90.3% | 83,840 | 84,130 |
| 80% | 80.0% | 74,524 | 74,499 |
| 70% | 71.2% | 65,209 | 66,329 |
| 60% | 59.7% | 55,893 | 55,641 |
| 50% | 50.3% | 46,578 | 46,827 |
| 40% | 39.1% | 37,262 | 36,444 |
| 30% | 29.5% | 27,947 | 27,449 |
| 20% | 20.1% | 18,631 | 18,746 |
| 10% | 9.8% | 9,316 | 9,083 |
| Active Idle | 0 | 0 | |
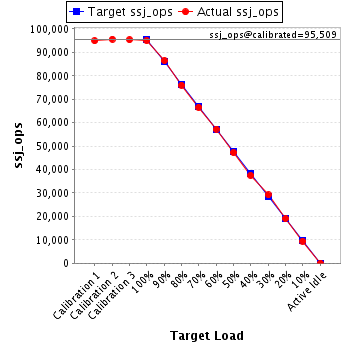
| Target Load | Actual Load | ssj_ops | |
|---|---|---|---|
| Target | Actual | ||
| Calibration 1 | 94,899 | ||
| Calibration 2 | 95,652 | ||
| Calibration 3 | 95,365 | ||
| ssj_ops@calibrated=95,509 | |||
| 100% | 99.5% | 95,509 | 95,030 |
| 90% | 90.6% | 85,958 | 86,499 |
| 80% | 79.6% | 76,407 | 76,014 |
| 70% | 69.7% | 66,856 | 66,575 |
| 60% | 60.0% | 57,305 | 57,291 |
| 50% | 49.5% | 47,754 | 47,250 |
| 40% | 39.3% | 38,204 | 37,499 |
| 30% | 30.6% | 28,653 | 29,215 |
| 20% | 19.9% | 19,102 | 19,050 |
| 10% | 9.9% | 9,551 | 9,462 |
| Active Idle | 0 | 0 | |
| Target Load | Actual Load | ssj_ops | |
|---|---|---|---|
| Target | Actual | ||
| Calibration 1 | 93,053 | ||
| Calibration 2 | 92,510 | ||
| Calibration 3 | 93,099 | ||
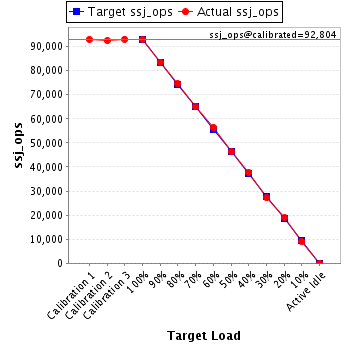
| ssj_ops@calibrated=92,804 | |||
| 100% | 100.2% | 92,804 | 92,988 |
| 90% | 90.1% | 83,524 | 83,580 |
| 80% | 80.5% | 74,243 | 74,683 |
| 70% | 70.0% | 64,963 | 64,933 |
| 60% | 60.9% | 55,683 | 56,472 |
| 50% | 50.1% | 46,402 | 46,456 |
| 40% | 40.6% | 37,122 | 37,711 |
| 30% | 29.3% | 27,841 | 27,237 |
| 20% | 20.3% | 18,561 | 18,823 |
| 10% | 9.8% | 9,280 | 9,054 |
| Active Idle | 0 | 0 | |
| Target Load | Actual Load | ssj_ops | |
|---|---|---|---|
| Target | Actual | ||
| Calibration 1 | 95,234 | ||
| Calibration 2 | 95,455 | ||
| Calibration 3 | 95,806 | ||
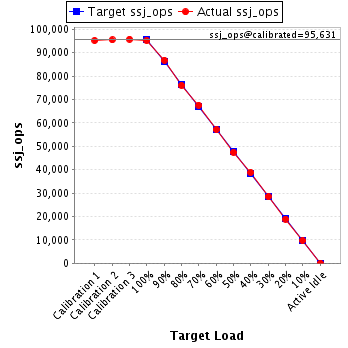
| ssj_ops@calibrated=95,631 | |||
| 100% | 99.6% | 95,631 | 95,218 |
| 90% | 90.8% | 86,068 | 86,865 |
| 80% | 79.5% | 76,504 | 76,049 |
| 70% | 70.7% | 66,941 | 67,633 |
| 60% | 59.8% | 57,378 | 57,181 |
| 50% | 49.6% | 47,815 | 47,446 |
| 40% | 40.6% | 38,252 | 38,856 |
| 30% | 29.8% | 28,689 | 28,466 |
| 20% | 19.8% | 19,126 | 18,917 |
| 10% | 10.2% | 9,563 | 9,729 |
| Active Idle | 0 | 0 | |
| Target Load | Actual Load | ssj_ops | |
|---|---|---|---|
| Target | Actual | ||
| Calibration 1 | 95,031 | ||
| Calibration 2 | 94,825 | ||
| Calibration 3 | 94,305 | ||
| ssj_ops@calibrated=94,565 | |||
| 100% | 100.4% | 94,565 | 94,909 |
| 90% | 90.1% | 85,109 | 85,156 |
| 80% | 80.2% | 75,652 | 75,868 |
| 70% | 70.5% | 66,196 | 66,668 |
| 60% | 59.9% | 56,739 | 56,659 |
| 50% | 49.5% | 47,283 | 46,853 |
| 40% | 40.6% | 37,826 | 38,384 |
| 30% | 29.9% | 28,370 | 28,322 |
| 20% | 20.0% | 18,913 | 18,883 |
| 10% | 10.1% | 9,457 | 9,542 |
| Active Idle | 0 | 0 | |

| Target Load | Actual Load | ssj_ops | |
|---|---|---|---|
| Target | Actual | ||
| Calibration 1 | 93,566 | ||
| Calibration 2 | 95,755 | ||
| Calibration 3 | 95,462 | ||
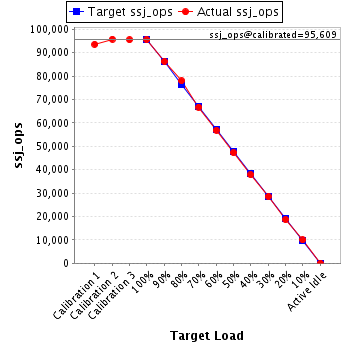
| ssj_ops@calibrated=95,609 | |||
| 100% | 100.0% | 95,609 | 95,566 |
| 90% | 90.2% | 86,048 | 86,271 |
| 80% | 81.5% | 76,487 | 77,938 |
| 70% | 69.8% | 66,926 | 66,750 |
| 60% | 59.4% | 57,365 | 56,835 |
| 50% | 49.4% | 47,804 | 47,207 |
| 40% | 39.5% | 38,243 | 37,789 |
| 30% | 29.8% | 28,683 | 28,521 |
| 20% | 19.5% | 19,122 | 18,662 |
| 10% | 10.4% | 9,561 | 9,956 |
| Active Idle | 0 | 0 | |
| Target Load | Actual Load | ssj_ops | |
|---|---|---|---|
| Target | Actual | ||
| Calibration 1 | 92,675 | ||
| Calibration 2 | 94,053 | ||
| Calibration 3 | 94,488 | ||
| ssj_ops@calibrated=94,270 | |||
| 100% | 100.3% | 94,270 | 94,582 |
| 90% | 91.1% | 84,843 | 85,887 |
| 80% | 78.8% | 75,416 | 74,281 |
| 70% | 69.1% | 65,989 | 65,186 |
| 60% | 60.5% | 56,562 | 56,992 |
| 50% | 49.4% | 47,135 | 46,543 |
| 40% | 40.3% | 37,708 | 38,001 |
| 30% | 30.0% | 28,281 | 28,298 |
| 20% | 20.1% | 18,854 | 18,934 |
| 10% | 10.1% | 9,427 | 9,525 |
| Active Idle | 0 | 0 | |

| Target Load | Actual Load | ssj_ops | |
|---|---|---|---|
| Target | Actual | ||
| Calibration 1 | 93,875 | ||
| Calibration 2 | 94,565 | ||
| Calibration 3 | 93,896 | ||
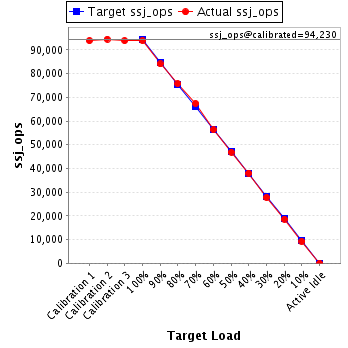
| ssj_ops@calibrated=94,230 | |||
| 100% | 99.7% | 94,230 | 93,954 |
| 90% | 89.3% | 84,807 | 84,104 |
| 80% | 80.4% | 75,384 | 75,806 |
| 70% | 71.6% | 65,961 | 67,440 |
| 60% | 59.8% | 56,538 | 56,341 |
| 50% | 49.8% | 47,115 | 46,883 |
| 40% | 40.4% | 37,692 | 38,027 |
| 30% | 29.5% | 28,269 | 27,755 |
| 20% | 19.7% | 18,846 | 18,603 |
| 10% | 9.8% | 9,423 | 9,217 |
| Active Idle | 0 | 0 | |
| Target Load | Actual Load | ssj_ops | |
|---|---|---|---|
| Target | Actual | ||
| Calibration 1 | 94,372 | ||
| Calibration 2 | 94,975 | ||
| Calibration 3 | 94,703 | ||
| ssj_ops@calibrated=94,839 | |||
| 100% | 99.9% | 94,839 | 94,734 |
| 90% | 90.1% | 85,355 | 85,418 |
| 80% | 80.6% | 75,871 | 76,406 |
| 70% | 70.3% | 66,387 | 66,685 |
| 60% | 59.3% | 56,903 | 56,276 |
| 50% | 50.9% | 47,419 | 48,253 |
| 40% | 40.3% | 37,936 | 38,212 |
| 30% | 30.1% | 28,452 | 28,558 |
| 20% | 19.4% | 18,968 | 18,379 |
| 10% | 10.1% | 9,484 | 9,554 |
| Active Idle | 0 | 0 | |

| Target Load | Actual Load | ssj_ops | |
|---|---|---|---|
| Target | Actual | ||
| Calibration 1 | 93,577 | ||
| Calibration 2 | 94,308 | ||
| Calibration 3 | 95,033 | ||
| ssj_ops@calibrated=94,671 | |||
| 100% | 99.6% | 94,671 | 94,322 |
| 90% | 89.5% | 85,204 | 84,711 |
| 80% | 79.3% | 75,737 | 75,119 |
| 70% | 69.6% | 66,270 | 65,918 |
| 60% | 59.1% | 56,802 | 55,910 |
| 50% | 50.2% | 47,335 | 47,497 |
| 40% | 40.3% | 37,868 | 38,115 |
| 30% | 29.4% | 28,401 | 27,849 |
| 20% | 19.4% | 18,934 | 18,385 |
| 10% | 10.1% | 9,467 | 9,525 |
| Active Idle | 0 | 0 | |

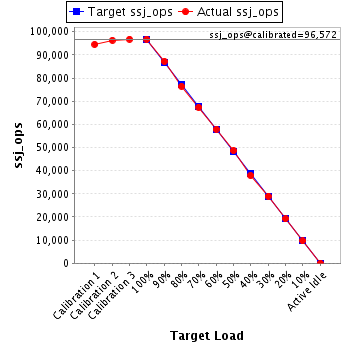
| Target Load | Actual Load | ssj_ops | |
|---|---|---|---|
| Target | Actual | ||
| Calibration 1 | 94,542 | ||
| Calibration 2 | 96,330 | ||
| Calibration 3 | 96,815 | ||
| ssj_ops@calibrated=96,572 | |||
| 100% | 100.2% | 96,572 | 96,775 |
| 90% | 90.3% | 86,915 | 87,247 |
| 80% | 79.2% | 77,258 | 76,499 |
| 70% | 69.8% | 67,601 | 67,410 |
| 60% | 60.0% | 57,943 | 57,966 |
| 50% | 50.4% | 48,286 | 48,642 |
| 40% | 39.3% | 38,629 | 37,912 |
| 30% | 30.0% | 28,972 | 28,985 |
| 20% | 19.9% | 19,314 | 19,189 |
| 10% | 10.0% | 9,657 | 9,675 |
| Active Idle | 0 | 0 | |
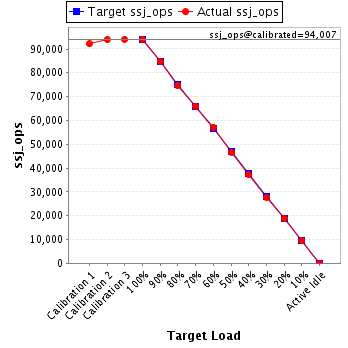
| Target Load | Actual Load | ssj_ops | |
|---|---|---|---|
| Target | Actual | ||
| Calibration 1 | 92,169 | ||
| Calibration 2 | 93,945 | ||
| Calibration 3 | 94,069 | ||
| ssj_ops@calibrated=94,007 | |||
| 100% | 100.1% | 94,007 | 94,130 |
| 90% | 90.3% | 84,606 | 84,908 |
| 80% | 79.5% | 75,206 | 74,749 |
| 70% | 70.2% | 65,805 | 66,001 |
| 60% | 60.7% | 56,404 | 57,034 |
| 50% | 49.6% | 47,004 | 46,650 |
| 40% | 39.6% | 37,603 | 37,216 |
| 30% | 29.5% | 28,202 | 27,704 |
| 20% | 19.9% | 18,801 | 18,723 |
| 10% | 10.0% | 9,401 | 9,370 |
| Active Idle | 0 | 0 | |
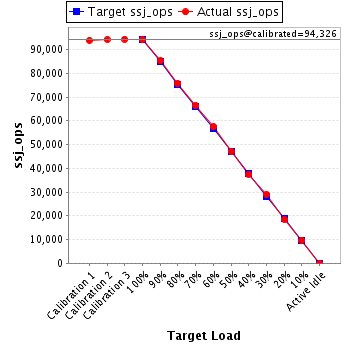
| Target Load | Actual Load | ssj_ops | |
|---|---|---|---|
| Target | Actual | ||
| Calibration 1 | 93,868 | ||
| Calibration 2 | 94,263 | ||
| Calibration 3 | 94,389 | ||
| ssj_ops@calibrated=94,326 | |||
| 100% | 99.8% | 94,326 | 94,172 |
| 90% | 90.3% | 84,894 | 85,199 |
| 80% | 80.3% | 75,461 | 75,783 |
| 70% | 70.6% | 66,028 | 66,619 |
| 60% | 61.0% | 56,596 | 57,510 |
| 50% | 50.1% | 47,163 | 47,232 |
| 40% | 39.8% | 37,731 | 37,516 |
| 30% | 30.8% | 28,298 | 29,029 |
| 20% | 19.6% | 18,865 | 18,522 |
| 10% | 10.2% | 9,433 | 9,629 |
| Active Idle | 0 | 0 | |
| Target Load | Actual Load | ssj_ops | |
|---|---|---|---|
| Target | Actual | ||
| Calibration 1 | 94,928 | ||
| Calibration 2 | 93,364 | ||
| Calibration 3 | 93,583 | ||
| ssj_ops@calibrated=93,473 | |||
| 100% | 100.2% | 93,473 | 93,702 |
| 90% | 90.4% | 84,126 | 84,517 |
| 80% | 80.7% | 74,779 | 75,446 |
| 70% | 70.0% | 65,431 | 65,393 |
| 60% | 61.1% | 56,084 | 57,100 |
| 50% | 50.1% | 46,737 | 46,806 |
| 40% | 40.0% | 37,389 | 37,369 |
| 30% | 29.7% | 28,042 | 27,766 |
| 20% | 19.7% | 18,695 | 18,387 |
| 10% | 10.2% | 9,347 | 9,579 |
| Active Idle | 0 | 0 | |

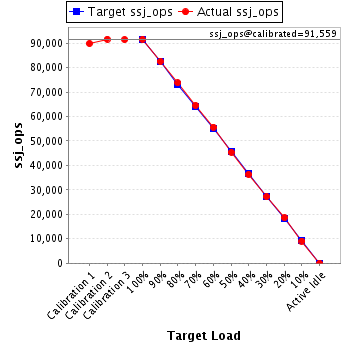
| Target Load | Actual Load | ssj_ops | |
|---|---|---|---|
| Target | Actual | ||
| Calibration 1 | 89,878 | ||
| Calibration 2 | 91,640 | ||
| Calibration 3 | 91,478 | ||
| ssj_ops@calibrated=91,559 | |||
| 100% | 100.0% | 91,559 | 91,602 |
| 90% | 90.2% | 82,403 | 82,554 |
| 80% | 80.6% | 73,247 | 73,751 |
| 70% | 70.5% | 64,091 | 64,579 |
| 60% | 60.8% | 54,935 | 55,671 |
| 50% | 49.6% | 45,780 | 45,401 |
| 40% | 39.7% | 36,624 | 36,332 |
| 30% | 29.7% | 27,468 | 27,228 |
| 20% | 20.3% | 18,312 | 18,631 |
| 10% | 9.9% | 9,156 | 9,079 |
| Active Idle | 0 | 0 | |
| Target Load | Actual Load | ssj_ops | |
|---|---|---|---|
| Target | Actual | ||
| Calibration 1 | 95,841 | ||
| Calibration 2 | 96,025 | ||
| Calibration 3 | 95,970 | ||
| ssj_ops@calibrated=95,997 | |||
| 100% | 99.6% | 95,997 | 95,638 |
| 90% | 90.5% | 86,398 | 86,920 |
| 80% | 80.1% | 76,798 | 76,937 |
| 70% | 71.1% | 67,198 | 68,290 |
| 60% | 59.7% | 57,598 | 57,358 |
| 50% | 49.6% | 47,999 | 47,654 |
| 40% | 38.7% | 38,399 | 37,168 |
| 30% | 29.6% | 28,799 | 28,435 |
| 20% | 19.9% | 19,199 | 19,131 |
| 10% | 9.7% | 9,600 | 9,321 |
| Active Idle | 0 | 0 | |

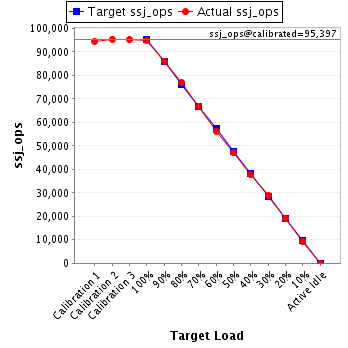
| Target Load | Actual Load | ssj_ops | |
|---|---|---|---|
| Target | Actual | ||
| Calibration 1 | 94,590 | ||
| Calibration 2 | 95,461 | ||
| Calibration 3 | 95,332 | ||
| ssj_ops@calibrated=95,397 | |||
| 100% | 99.5% | 95,397 | 94,957 |
| 90% | 90.3% | 85,857 | 86,122 |
| 80% | 80.6% | 76,317 | 76,937 |
| 70% | 70.2% | 66,778 | 66,985 |
| 60% | 59.0% | 57,238 | 56,327 |
| 50% | 49.3% | 47,698 | 47,007 |
| 40% | 39.5% | 38,159 | 37,682 |
| 30% | 30.2% | 28,619 | 28,851 |
| 20% | 20.0% | 19,079 | 19,085 |
| 10% | 9.9% | 9,540 | 9,417 |
| Active Idle | 0 | 0 | |
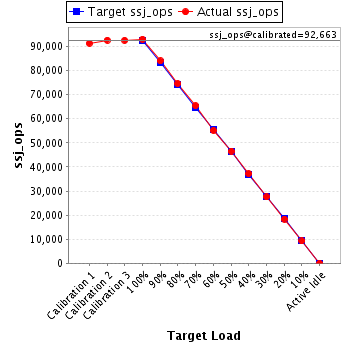
| Target Load | Actual Load | ssj_ops | |
|---|---|---|---|
| Target | Actual | ||
| Calibration 1 | 91,437 | ||
| Calibration 2 | 92,701 | ||
| Calibration 3 | 92,625 | ||
| ssj_ops@calibrated=92,663 | |||
| 100% | 100.4% | 92,663 | 93,076 |
| 90% | 90.7% | 83,397 | 84,075 |
| 80% | 80.6% | 74,130 | 74,647 |
| 70% | 70.6% | 64,864 | 65,435 |
| 60% | 59.6% | 55,598 | 55,196 |
| 50% | 50.2% | 46,332 | 46,561 |
| 40% | 40.1% | 37,065 | 37,196 |
| 30% | 29.7% | 27,799 | 27,523 |
| 20% | 19.8% | 18,533 | 18,379 |
| 10% | 10.0% | 9,266 | 9,254 |
| Active Idle | 0 | 0 | |
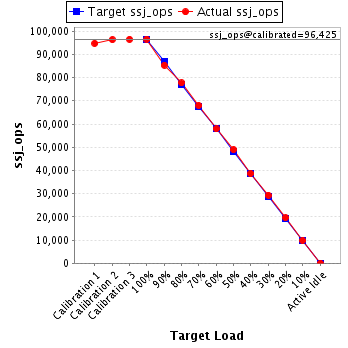
| Target Load | Actual Load | ssj_ops | |
|---|---|---|---|
| Target | Actual | ||
| Calibration 1 | 94,747 | ||
| Calibration 2 | 96,314 | ||
| Calibration 3 | 96,536 | ||
| ssj_ops@calibrated=96,425 | |||
| 100% | 100.1% | 96,425 | 96,550 |
| 90% | 88.5% | 86,783 | 85,344 |
| 80% | 80.6% | 77,140 | 77,689 |
| 70% | 70.5% | 67,498 | 68,006 |
| 60% | 60.1% | 57,855 | 57,905 |
| 50% | 50.7% | 48,213 | 48,917 |
| 40% | 40.1% | 38,570 | 38,658 |
| 30% | 30.4% | 28,928 | 29,332 |
| 20% | 20.3% | 19,285 | 19,547 |
| 10% | 10.2% | 9,643 | 9,871 |
| Active Idle | 0 | 0 | |
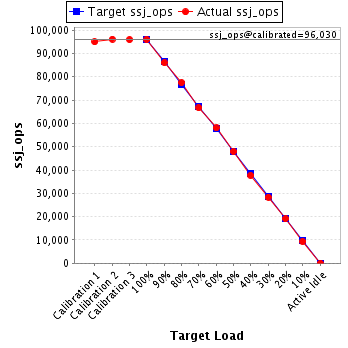
| Target Load | Actual Load | ssj_ops | |
|---|---|---|---|
| Target | Actual | ||
| Calibration 1 | 94,941 | ||
| Calibration 2 | 96,148 | ||
| Calibration 3 | 95,912 | ||
| ssj_ops@calibrated=96,030 | |||
| 100% | 100.0% | 96,030 | 96,025 |
| 90% | 89.6% | 86,427 | 86,035 |
| 80% | 80.7% | 76,824 | 77,468 |
| 70% | 69.4% | 67,221 | 66,655 |
| 60% | 60.5% | 57,618 | 58,054 |
| 50% | 50.0% | 48,015 | 48,028 |
| 40% | 39.3% | 38,412 | 37,715 |
| 30% | 29.6% | 28,809 | 28,398 |
| 20% | 19.8% | 19,206 | 19,054 |
| 10% | 9.7% | 9,603 | 9,323 |
| Active Idle | 0 | 0 | |
| Target Load | Actual Load | ssj_ops | |
|---|---|---|---|
| Target | Actual | ||
| Calibration 1 | 95,107 | ||
| Calibration 2 | 96,190 | ||
| Calibration 3 | 95,966 | ||
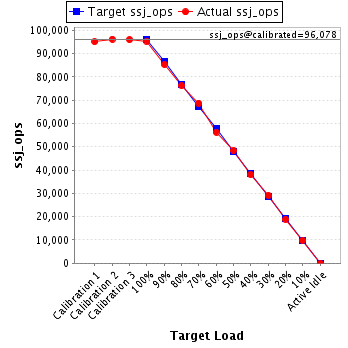
| ssj_ops@calibrated=96,078 | |||
| 100% | 99.2% | 96,078 | 95,308 |
| 90% | 88.9% | 86,470 | 85,380 |
| 80% | 79.3% | 76,862 | 76,194 |
| 70% | 71.5% | 67,255 | 68,737 |
| 60% | 58.6% | 57,647 | 56,305 |
| 50% | 50.3% | 48,039 | 48,345 |
| 40% | 39.7% | 38,431 | 38,100 |
| 30% | 30.3% | 28,823 | 29,103 |
| 20% | 19.7% | 19,216 | 18,906 |
| 10% | 10.2% | 9,608 | 9,771 |
| Active Idle | 0 | 0 | |
| Target Load | Actual Load | ssj_ops | |
|---|---|---|---|
| Target | Actual | ||
| Calibration 1 | 94,350 | ||
| Calibration 2 | 95,182 | ||
| Calibration 3 | 95,258 | ||
| ssj_ops@calibrated=95,220 | |||
| 100% | 99.8% | 95,220 | 95,069 |
| 90% | 89.2% | 85,698 | 84,901 |
| 80% | 80.3% | 76,176 | 76,450 |
| 70% | 71.1% | 66,654 | 67,730 |
| 60% | 59.7% | 57,132 | 56,839 |
| 50% | 50.7% | 47,610 | 48,300 |
| 40% | 39.8% | 38,088 | 37,925 |
| 30% | 29.8% | 28,566 | 28,390 |
| 20% | 20.1% | 19,044 | 19,186 |
| 10% | 10.0% | 9,522 | 9,561 |
| Active Idle | 0 | 0 | |

| Target Load | Actual Load | ssj_ops | |
|---|---|---|---|
| Target | Actual | ||
| Calibration 1 | 93,692 | ||
| Calibration 2 | 95,764 | ||
| Calibration 3 | 95,483 | ||
| ssj_ops@calibrated=95,623 | |||
| 100% | 99.9% | 95,623 | 95,528 |
| 90% | 90.7% | 86,061 | 86,685 |
| 80% | 79.7% | 76,498 | 76,170 |
| 70% | 70.1% | 66,936 | 67,079 |
| 60% | 60.0% | 57,374 | 57,332 |
| 50% | 49.2% | 47,812 | 47,026 |
| 40% | 41.1% | 38,249 | 39,256 |
| 30% | 30.1% | 28,687 | 28,758 |
| 20% | 19.8% | 19,125 | 18,917 |
| 10% | 10.3% | 9,562 | 9,861 |
| Active Idle | 0 | 0 | |

| Target Load | Actual Load | ssj_ops | |
|---|---|---|---|
| Target | Actual | ||
| Calibration 1 | 94,396 | ||
| Calibration 2 | 94,547 | ||
| Calibration 3 | 94,337 | ||
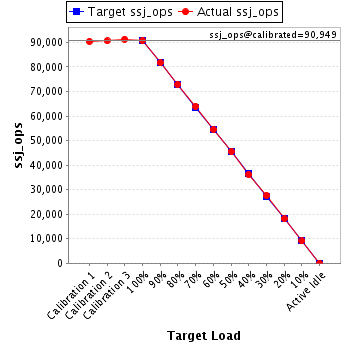
| ssj_ops@calibrated=94,442 | |||
| 100% | 99.3% | 94,442 | 93,779 |
| 90% | 88.9% | 84,998 | 83,937 |
| 80% | 79.4% | 75,553 | 75,000 |
| 70% | 69.5% | 66,109 | 65,643 |
| 60% | 59.5% | 56,665 | 56,162 |
| 50% | 49.9% | 47,221 | 47,166 |
| 40% | 40.2% | 37,777 | 37,928 |
| 30% | 29.5% | 28,333 | 27,836 |
| 20% | 19.8% | 18,888 | 18,698 |
| 10% | 10.4% | 9,444 | 9,850 |
| Active Idle | 0 | 0 | |