SPECpower_ssj2008
Host 'NODE09' Performance Report
Copyright © 2007-2019 Standard Performance Evaluation Corporation
| Hewlett Packard Enterprise Synergy 480 Gen10 Compute Module | ssj_ops@100% = 5,740,284 ssj_ops@100% per JVM = 1,435,071 |
||||
| Test Sponsor: | Hewlett Packard Enterprise | SPEC License #: | 3 | Test Method: | Multi Node |
| Tested By: | Hewlett Packard Enterprise | Test Location: | Houston, TX, USA | Test Date: | Mar 26, 2019 |
| Hardware Availability: | Apr-2019 | Software Availability: | Mar-2019 | Publication: | May 8, 2019 |
| System Source: | Single Supplier | System Designation: | Server | Power Provisioning: | Line-powered |
| Target Load | Actual Load | ssj_ops | |
|---|---|---|---|
| Target | Actual | ||
| Calibration 1 | 5,756,192 | ||
| Calibration 2 | 5,751,940 | ||
| Calibration 3 | 5,755,063 | ||
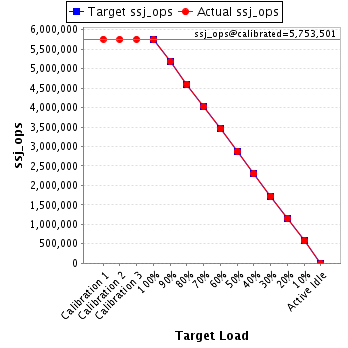
| ssj_ops@calibrated=5,753,501 | |||
| 100% | 99.8% | 5,753,501 | 5,740,284 |
| 90% | 90.0% | 5,178,151 | 5,180,070 |
| 80% | 80.0% | 4,602,801 | 4,602,620 |
| 70% | 69.9% | 4,027,451 | 4,021,431 |
| 60% | 60.0% | 3,452,101 | 3,453,021 |
| 50% | 50.0% | 2,876,751 | 2,875,584 |
| 40% | 40.0% | 2,301,401 | 2,302,073 |
| 30% | 30.0% | 1,726,050 | 1,725,721 |
| 20% | 20.0% | 1,150,700 | 1,152,246 |
| 10% | 10.0% | 575,350 | 574,174 |
| Active Idle | 0 | 0 | |
| Set Identifier: | SUT |
| Set Description: | System Under Test |
| # of Identical Nodes: | 9 |
| Comment: | SUT |
| Hardware | |
|---|---|
| Hardware Vendor: | Hewlett Packard Enterprise |
| Model: | Synergy 480 Gen10 Compute Module |
| Form Factor: | 7U |
| CPU Name: | Intel Xeon Platinum 8280 @ 2.70GHz (Intel Turbo Boost Technology up to 4.00 GHz) |
| CPU Characteristics: | 28-Core, 2.70 GHz, 38.5MB L3 Cache |
| CPU Frequency (MHz): | 2700 |
| CPU(s) Enabled: | 56 cores, 2 chips, 28 cores/chip |
| Hardware Threads: | 112 (2 / core) |
| CPU(s) Orderable: | 1,2 chips |
| Primary Cache: | 32 KB I + 32 KB D on chip per core |
| Secondary Cache: | 1 MB I+D on chip per core |
| Tertiary Cache: | 39424 KB I+D on chip per chip |
| Other Cache: | None |
| Memory Amount (GB): | 192 |
| # and size of DIMM: | 12 x 16384 MB |
| Memory Details: | 12 x 16GB 2Rx8 PC4-2933Y-R; slots 1, 3, 5, 8, 10 and 12 populated in each socket |
| Power Supply Quantity and Rating (W): | None |
| Power Supply Details: | N/A |
| Disk Drive: | 1 x HPE 240GB 6G SATA M.2 SSD (875488-B21) |
| Disk Controller: | HPE Smart Array S100i SR Gen10 |
| # and type of Network Interface Cards (NICs) Installed: | 1 x HPE Synergy 3820C 10/20Gb CNA |
| NICs Enabled in Firmware / OS / Connected: | 2/2/1 |
| Network Speed (Mbit): | 1000 |
| Keyboard: | None |
| Mouse: | None |
| Monitor: | None |
| Optical Drives: | No |
| Other Hardware: | H/S: Standard |
| Software | |
|---|---|
| Power Management: | Enabled (see SUT Notes) |
| Operating System (OS): | Windows Server 2012 R2 Datacenter |
| OS Version: | Version 6.3 (Build 9600) |
| Filesystem: | NTFS |
| JVM Vendor: | Oracle Corporation |
| JVM Version: | Oracle Java HotSpot(TM) 64-Bit Server VM (build 24.80-b11, mixed mode), version 1.7.0_80 |
| JVM Command-line Options: | -server -Xmn21000m -Xms24000m -Xmx24000m -XX:SurvivorRatio=1 -XX:TargetSurvivorRatio=99 -XX:AllocatePrefetchDistance=256 -XX:AllocatePrefetchLines=4 -XX:LoopUnrollLimit=45 -XX:InitialTenuringThreshold=12 -XX:MaxTenuringThreshold=15 -XX:ParallelGCThreads=28 -XX:InlineSmallCode=3900 -XX:MaxInlineSize=270 -XX:FreqInlineSize=2500 -XX:+AggressiveOpts -XX:+UseLargePages -XX:+UseParallelOldGC |
| JVM Affinity: | start /NODE [0,1,2,3] /AFFINITY [0xFFFFFFF] |
| JVM Instances: | 4 |
| JVM Initial Heap (MB): | 24000 |
| JVM Maximum Heap (MB): | 24000 |
| JVM Address Bits: | 64 |
| Boot Firmware Version: | I42 v2.00 (02/02/2019) |
| Management Firmware Version: | 1.40 Feb 05 2019 |
| Workload Version: | SSJ 1.2.10 |
| Director Location: | Controller |
| Other Software: | HPE Service Pack for ProLiant (SPP) Version: 2019.03.0, Microsoft Windows KB4056898, KB4338815 |
| JVM Instance | ssj_ops@100% |
|---|---|
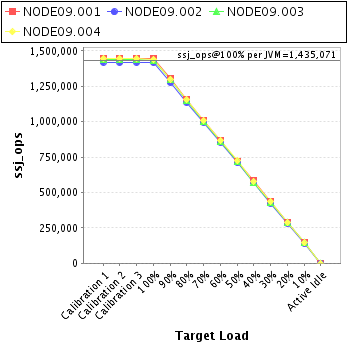
| NODE09.001 | 1,444,569 |
| NODE09.002 | 1,418,458 |
| NODE09.003 | 1,435,615 |
| NODE09.004 | 1,441,642 |
| ssj_ops@100% | 5,740,284 |
| ssj_ops@100% per JVM | 1,435,071 |
| Target Load | Actual Load | ssj_ops | |
|---|---|---|---|
| Target | Actual | ||
| Calibration 1 | 1,447,124 | ||
| Calibration 2 | 1,449,072 | ||
| Calibration 3 | 1,449,204 | ||
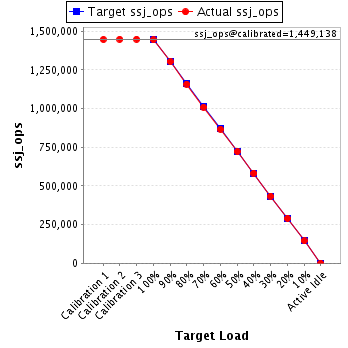
| ssj_ops@calibrated=1,449,138 | |||
| 100% | 99.7% | 1,449,138 | 1,444,569 |
| 90% | 90.0% | 1,304,225 | 1,304,036 |
| 80% | 79.9% | 1,159,311 | 1,158,440 |
| 70% | 69.7% | 1,014,397 | 1,010,202 |
| 60% | 59.9% | 869,483 | 867,814 |
| 50% | 49.8% | 724,569 | 722,036 |
| 40% | 40.2% | 579,655 | 581,945 |
| 30% | 30.0% | 434,742 | 434,833 |
| 20% | 20.0% | 289,828 | 290,164 |
| 10% | 10.0% | 144,914 | 144,844 |
| Active Idle | 0 | 0 | |
| Target Load | Actual Load | ssj_ops | |
|---|---|---|---|
| Target | Actual | ||
| Calibration 1 | 1,421,629 | ||
| Calibration 2 | 1,419,679 | ||
| Calibration 3 | 1,421,592 | ||
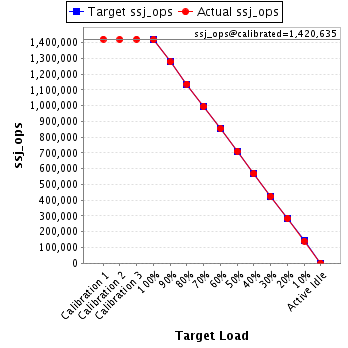
| ssj_ops@calibrated=1,420,635 | |||
| 100% | 99.8% | 1,420,635 | 1,418,458 |
| 90% | 89.9% | 1,278,572 | 1,277,779 |
| 80% | 80.0% | 1,136,508 | 1,136,915 |
| 70% | 70.1% | 994,445 | 995,456 |
| 60% | 60.2% | 852,381 | 855,076 |
| 50% | 50.0% | 710,318 | 710,751 |
| 40% | 40.0% | 568,254 | 567,821 |
| 30% | 29.9% | 426,191 | 425,266 |
| 20% | 20.0% | 284,127 | 284,435 |
| 10% | 9.9% | 142,064 | 140,522 |
| Active Idle | 0 | 0 | |
| Target Load | Actual Load | ssj_ops | |
|---|---|---|---|
| Target | Actual | ||
| Calibration 1 | 1,441,184 | ||
| Calibration 2 | 1,436,495 | ||
| Calibration 3 | 1,439,715 | ||
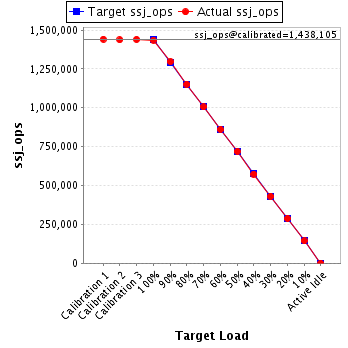
| ssj_ops@calibrated=1,438,105 | |||
| 100% | 99.8% | 1,438,105 | 1,435,615 |
| 90% | 90.1% | 1,294,295 | 1,296,368 |
| 80% | 80.1% | 1,150,484 | 1,151,518 |
| 70% | 69.9% | 1,006,674 | 1,004,971 |
| 60% | 60.0% | 862,863 | 862,249 |
| 50% | 50.1% | 719,053 | 719,839 |
| 40% | 39.9% | 575,242 | 573,798 |
| 30% | 30.0% | 431,432 | 431,314 |
| 20% | 20.0% | 287,621 | 287,672 |
| 10% | 10.0% | 143,811 | 143,877 |
| Active Idle | 0 | 0 | |
| Target Load | Actual Load | ssj_ops | |
|---|---|---|---|
| Target | Actual | ||
| Calibration 1 | 1,446,256 | ||
| Calibration 2 | 1,446,694 | ||
| Calibration 3 | 1,444,551 | ||
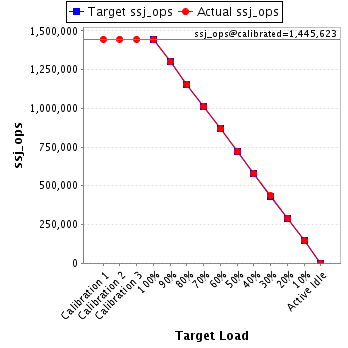
| ssj_ops@calibrated=1,445,623 | |||
| 100% | 99.7% | 1,445,623 | 1,441,642 |
| 90% | 90.1% | 1,301,060 | 1,301,886 |
| 80% | 79.9% | 1,156,498 | 1,155,747 |
| 70% | 69.9% | 1,011,936 | 1,010,802 |
| 60% | 60.0% | 867,374 | 867,882 |
| 50% | 50.0% | 722,811 | 722,957 |
| 40% | 40.0% | 578,249 | 578,509 |
| 30% | 30.0% | 433,687 | 434,308 |
| 20% | 20.1% | 289,125 | 289,975 |
| 10% | 10.0% | 144,562 | 144,932 |
| Active Idle | 0 | 0 | |