SPECpower_ssj2008
Host 'NODE01' Performance Report
Copyright © 2007-2019 Standard Performance Evaluation Corporation
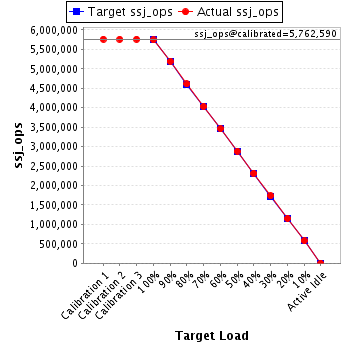
| Hewlett Packard Enterprise Synergy 480 Gen10 Compute Module | ssj_ops@100% = 5,742,722 ssj_ops@100% per JVM = 1,435,681 |
||||
| Test Sponsor: | Hewlett Packard Enterprise | SPEC License #: | 3 | Test Method: | Multi Node |
| Tested By: | Hewlett Packard Enterprise | Test Location: | Houston, TX, USA | Test Date: | Mar 26, 2019 |
| Hardware Availability: | Apr-2019 | Software Availability: | Mar-2019 | Publication: | May 8, 2019 |
| System Source: | Single Supplier | System Designation: | Server | Power Provisioning: | Line-powered |
| Target Load | Actual Load | ssj_ops | |
|---|---|---|---|
| Target | Actual | ||
| Calibration 1 | 5,763,355 | ||
| Calibration 2 | 5,761,728 | ||
| Calibration 3 | 5,763,451 | ||
| ssj_ops@calibrated=5,762,590 | |||
| 100% | 99.7% | 5,762,590 | 5,742,722 |
| 90% | 90.1% | 5,186,331 | 5,194,626 |
| 80% | 80.0% | 4,610,072 | 4,611,662 |
| 70% | 70.0% | 4,033,813 | 4,034,150 |
| 60% | 60.0% | 3,457,554 | 3,456,781 |
| 50% | 50.0% | 2,881,295 | 2,882,426 |
| 40% | 40.1% | 2,305,036 | 2,311,701 |
| 30% | 30.1% | 1,728,777 | 1,733,904 |
| 20% | 20.0% | 1,152,518 | 1,150,036 |
| 10% | 10.0% | 576,259 | 577,904 |
| Active Idle | 0 | 0 | |
| Set Identifier: | SUT |
| Set Description: | System Under Test |
| # of Identical Nodes: | 9 |
| Comment: | SUT |
| Hardware | |
|---|---|
| Hardware Vendor: | Hewlett Packard Enterprise |
| Model: | Synergy 480 Gen10 Compute Module |
| Form Factor: | 7U |
| CPU Name: | Intel Xeon Platinum 8280 @ 2.70GHz (Intel Turbo Boost Technology up to 4.00 GHz) |
| CPU Characteristics: | 28-Core, 2.70 GHz, 38.5MB L3 Cache |
| CPU Frequency (MHz): | 2700 |
| CPU(s) Enabled: | 56 cores, 2 chips, 28 cores/chip |
| Hardware Threads: | 112 (2 / core) |
| CPU(s) Orderable: | 1,2 chips |
| Primary Cache: | 32 KB I + 32 KB D on chip per core |
| Secondary Cache: | 1 MB I+D on chip per core |
| Tertiary Cache: | 39424 KB I+D on chip per chip |
| Other Cache: | None |
| Memory Amount (GB): | 192 |
| # and size of DIMM: | 12 x 16384 MB |
| Memory Details: | 12 x 16GB 2Rx8 PC4-2933Y-R; slots 1, 3, 5, 8, 10 and 12 populated in each socket |
| Power Supply Quantity and Rating (W): | None |
| Power Supply Details: | N/A |
| Disk Drive: | 1 x HPE 240GB 6G SATA M.2 SSD (875488-B21) |
| Disk Controller: | HPE Smart Array S100i SR Gen10 |
| # and type of Network Interface Cards (NICs) Installed: | 1 x HPE Synergy 3820C 10/20Gb CNA |
| NICs Enabled in Firmware / OS / Connected: | 2/2/1 |
| Network Speed (Mbit): | 1000 |
| Keyboard: | None |
| Mouse: | None |
| Monitor: | None |
| Optical Drives: | No |
| Other Hardware: | H/S: Standard |
| Software | |
|---|---|
| Power Management: | Enabled (see SUT Notes) |
| Operating System (OS): | Windows Server 2012 R2 Datacenter |
| OS Version: | Version 6.3 (Build 9600) |
| Filesystem: | NTFS |
| JVM Vendor: | Oracle Corporation |
| JVM Version: | Oracle Java HotSpot(TM) 64-Bit Server VM (build 24.80-b11, mixed mode), version 1.7.0_80 |
| JVM Command-line Options: | -server -Xmn21000m -Xms24000m -Xmx24000m -XX:SurvivorRatio=1 -XX:TargetSurvivorRatio=99 -XX:AllocatePrefetchDistance=256 -XX:AllocatePrefetchLines=4 -XX:LoopUnrollLimit=45 -XX:InitialTenuringThreshold=12 -XX:MaxTenuringThreshold=15 -XX:ParallelGCThreads=28 -XX:InlineSmallCode=3900 -XX:MaxInlineSize=270 -XX:FreqInlineSize=2500 -XX:+AggressiveOpts -XX:+UseLargePages -XX:+UseParallelOldGC |
| JVM Affinity: | start /NODE [0,1,2,3] /AFFINITY [0xFFFFFFF] |
| JVM Instances: | 4 |
| JVM Initial Heap (MB): | 24000 |
| JVM Maximum Heap (MB): | 24000 |
| JVM Address Bits: | 64 |
| Boot Firmware Version: | I42 v2.00 (02/02/2019) |
| Management Firmware Version: | 1.40 Feb 05 2019 |
| Workload Version: | SSJ 1.2.10 |
| Director Location: | Controller |
| Other Software: | HPE Service Pack for ProLiant (SPP) Version: 2019.03.0, Microsoft Windows KB4056898, KB4338815 |
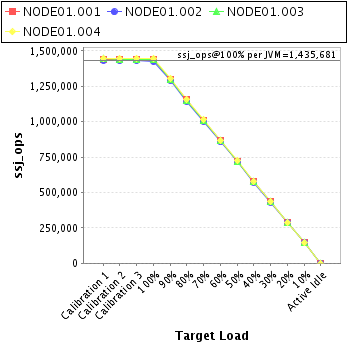
| JVM Instance | ssj_ops@100% |
|---|---|
| NODE01.001 | 1,436,006 |
| NODE01.002 | 1,425,635 |
| NODE01.003 | 1,437,678 |
| NODE01.004 | 1,443,403 |
| ssj_ops@100% | 5,742,722 |
| ssj_ops@100% per JVM | 1,435,681 |
| Target Load | Actual Load | ssj_ops | |
|---|---|---|---|
| Target | Actual | ||
| Calibration 1 | 1,440,621 | ||
| Calibration 2 | 1,442,949 | ||
| Calibration 3 | 1,441,852 | ||
| ssj_ops@calibrated=1,442,401 | |||
| 100% | 99.6% | 1,442,401 | 1,436,006 |
| 90% | 90.0% | 1,298,161 | 1,298,192 |
| 80% | 80.2% | 1,153,921 | 1,157,231 |
| 70% | 69.9% | 1,009,680 | 1,008,811 |
| 60% | 60.0% | 865,440 | 866,063 |
| 50% | 49.9% | 721,200 | 720,298 |
| 40% | 40.0% | 576,960 | 577,405 |
| 30% | 30.1% | 432,720 | 433,563 |
| 20% | 19.9% | 288,480 | 287,668 |
| 10% | 10.0% | 144,240 | 143,878 |
| Active Idle | 0 | 0 | |

| Target Load | Actual Load | ssj_ops | |
|---|---|---|---|
| Target | Actual | ||
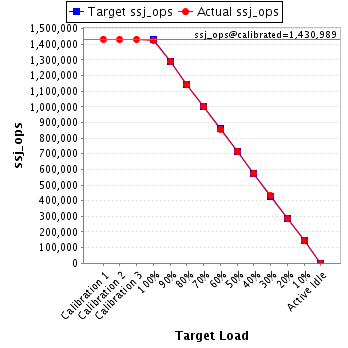
| Calibration 1 | 1,432,973 | ||
| Calibration 2 | 1,430,424 | ||
| Calibration 3 | 1,431,554 | ||
| ssj_ops@calibrated=1,430,989 | |||
| 100% | 99.6% | 1,430,989 | 1,425,635 |
| 90% | 90.2% | 1,287,890 | 1,290,146 |
| 80% | 79.9% | 1,144,791 | 1,143,154 |
| 70% | 70.0% | 1,001,692 | 1,001,391 |
| 60% | 59.9% | 858,593 | 856,737 |
| 50% | 50.0% | 715,494 | 715,422 |
| 40% | 40.1% | 572,395 | 573,669 |
| 30% | 30.2% | 429,297 | 432,273 |
| 20% | 20.0% | 286,198 | 286,503 |
| 10% | 10.0% | 143,099 | 143,605 |
| Active Idle | 0 | 0 | |
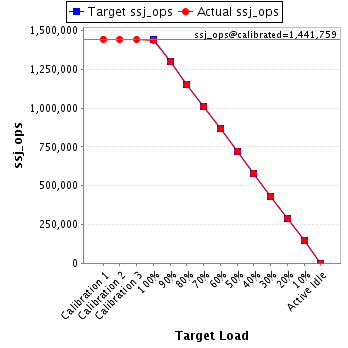
| Target Load | Actual Load | ssj_ops | |
|---|---|---|---|
| Target | Actual | ||
| Calibration 1 | 1,443,628 | ||
| Calibration 2 | 1,442,280 | ||
| Calibration 3 | 1,441,238 | ||
| ssj_ops@calibrated=1,441,759 | |||
| 100% | 99.7% | 1,441,759 | 1,437,678 |
| 90% | 90.2% | 1,297,583 | 1,300,099 |
| 80% | 79.9% | 1,153,407 | 1,152,351 |
| 70% | 70.0% | 1,009,231 | 1,009,471 |
| 60% | 60.0% | 865,056 | 865,347 |
| 50% | 50.1% | 720,880 | 722,359 |
| 40% | 40.2% | 576,704 | 580,296 |
| 30% | 30.0% | 432,528 | 433,004 |
| 20% | 20.0% | 288,352 | 287,757 |
| 10% | 10.1% | 144,176 | 145,239 |
| Active Idle | 0 | 0 | |
| Target Load | Actual Load | ssj_ops | |
|---|---|---|---|
| Target | Actual | ||
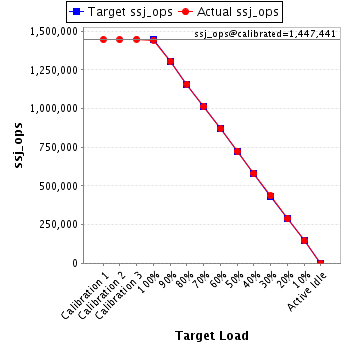
| Calibration 1 | 1,446,132 | ||
| Calibration 2 | 1,446,076 | ||
| Calibration 3 | 1,448,807 | ||
| ssj_ops@calibrated=1,447,441 | |||
| 100% | 99.7% | 1,447,441 | 1,443,403 |
| 90% | 90.2% | 1,302,697 | 1,306,188 |
| 80% | 80.1% | 1,157,953 | 1,158,925 |
| 70% | 70.1% | 1,013,209 | 1,014,477 |
| 60% | 60.0% | 868,465 | 868,634 |
| 50% | 50.0% | 723,721 | 724,347 |
| 40% | 40.1% | 578,977 | 580,332 |
| 30% | 30.1% | 434,232 | 435,064 |
| 20% | 19.9% | 289,488 | 288,109 |
| 10% | 10.0% | 144,744 | 145,181 |
| Active Idle | 0 | 0 | |