
SPECpower_ssj2008
Aggregate Performance Report
Copyright © 2007-2019 Standard Performance Evaluation Corporation
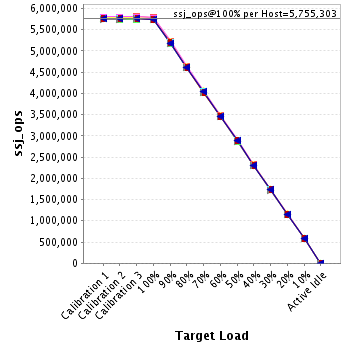
| Hewlett Packard Enterprise Synergy 480 Gen10 Compute Module | ssj_ops@100% = 57,553,033 ssj_ops@100% per Host = 5,755,303 ssj_ops@100% per JVM = 1,438,826 |
||||
| Test Sponsor: | Hewlett Packard Enterprise | SPEC License #: | 3 | Test Method: | Multi Node |
| Tested By: | Hewlett Packard Enterprise | Test Location: | Houston, TX, USA | Test Date: | Mar 26, 2019 |
| Hardware Availability: | Apr-2019 | Software Availability: | Mar-2019 | Publication: | May 8, 2019 |
| System Source: | Single Supplier | System Designation: | Server | Power Provisioning: | Line-powered |
| Target Load | Actual Load | ssj_ops | |
|---|---|---|---|
| Target | Actual | ||
| Calibration 1 | 57,725,322 | ||
| Calibration 2 | 57,679,059 | ||
| Calibration 3 | 57,756,235 | ||
| ssj_ops@calibrated=57,717,647 | |||
| 100% | 99.7% | 57,717,647 | 57,553,033 |
| 90% | 90.0% | 51,945,883 | 51,973,112 |
| 80% | 80.0% | 46,174,118 | 46,194,421 |
| 70% | 70.0% | 40,402,353 | 40,392,143 |
| 60% | 60.0% | 34,630,588 | 34,644,863 |
| 50% | 50.0% | 28,858,824 | 28,856,605 |
| 40% | 40.0% | 23,087,059 | 23,087,130 |
| 30% | 30.0% | 17,315,294 | 17,306,768 |
| 20% | 20.0% | 11,543,529 | 11,559,498 |
| 10% | 10.0% | 5,771,765 | 5,778,754 |
| Active Idle | 0 | 0 | |

| # of Nodes | # of Chips | # of Cores | # of Threads | Total RAM (GB) | # of OS Images | # of JVM Instances |
|---|---|---|---|---|---|---|
| 10 | 20 | 560 | 1,120 | 1,920 | 10 | 40 |
| Set Identifier: | SUT |
| Set Description: | System Under Test |
| # of Identical Nodes: | 10 |
| Comment: | SUT |
| Hardware per Node | |
|---|---|
| Hardware Vendor: | Hewlett Packard Enterprise |
| Model: | Synergy 480 Gen10 Compute Module |
| Form Factor: | 7U |
| CPU Name: | Intel Xeon Platinum 8280 @ 2.70GHz (Intel Turbo Boost Technology up to 4.00 GHz) |
| CPU Characteristics: | 28-Core, 2.70 GHz, 38.5MB L3 Cache |
| CPU Frequency (MHz): | 2700 |
| CPU(s) Enabled: | 56 cores, 2 chips, 28 cores/chip |
| Hardware Threads: | 112 (2 / core) |
| CPU(s) Orderable: | 1,2 chips |
| Primary Cache: | 32 KB I + 32 KB D on chip per core |
| Secondary Cache: | 1 MB I+D on chip per core |
| Tertiary Cache: | 39424 KB I+D on chip per chip |
| Other Cache: | None |
| Memory Amount (GB): | 192 |
| # and size of DIMM: | 12 x 16384 MB |
| Memory Details: | 12 x 16GB 2Rx8 PC4-2933Y-R; slots 1, 3, 5, 8, 10 and 12 populated in each socket |
| Power Supply Quantity and Rating (W): | None |
| Power Supply Details: | N/A |
| Disk Drive: | 1 x HPE 240GB 6G SATA M.2 SSD (875488-B21) |
| Disk Controller: | HPE Smart Array S100i SR Gen10 |
| # and type of Network Interface Cards (NICs) Installed: | 1 x HPE Synergy 3820C 10/20Gb CNA |
| NICs Enabled in Firmware / OS / Connected: | 2/2/1 |
| Network Speed (Mbit): | 1000 |
| Keyboard: | None |
| Mouse: | None |
| Monitor: | None |
| Optical Drives: | No |
| Other Hardware: | H/S: Standard |
| Software per Node | |
|---|---|
| Power Management: | Enabled (see SUT Notes) |
| Operating System (OS): | Windows Server 2012 R2 Datacenter |
| OS Version: | Version 6.3 (Build 9600) |
| Filesystem: | NTFS |
| JVM Vendor: | Oracle Corporation |
| JVM Version: | Oracle Java HotSpot(TM) 64-Bit Server VM (build 24.80-b11, mixed mode), version 1.7.0_80 |
| JVM Command-line Options: | -server -Xmn21000m -Xms24000m -Xmx24000m -XX:SurvivorRatio=1 -XX:TargetSurvivorRatio=99 -XX:AllocatePrefetchDistance=256 -XX:AllocatePrefetchLines=4 -XX:LoopUnrollLimit=45 -XX:InitialTenuringThreshold=12 -XX:MaxTenuringThreshold=15 -XX:ParallelGCThreads=28 -XX:InlineSmallCode=3900 -XX:MaxInlineSize=270 -XX:FreqInlineSize=2500 -XX:+AggressiveOpts -XX:+UseLargePages -XX:+UseParallelOldGC |
| JVM Affinity: | start /NODE [0,1,2,3] /AFFINITY [0xFFFFFFF] |
| JVM Instances: | 4 |
| JVM Initial Heap (MB): | 24000 |
| JVM Maximum Heap (MB): | 24000 |
| JVM Address Bits: | 64 |
| Boot Firmware Version: | I42 v2.00 (02/02/2019) |
| Management Firmware Version: | 1.40 Feb 05 2019 |
| Workload Version: | SSJ 1.2.10 |
| Director Location: | Controller |
| Other Software: | HPE Service Pack for ProLiant (SPP) Version: 2019.03.0, Microsoft Windows KB4056898, KB4338815 |
| Host | ssj_ops@100% |
|---|---|
| NODE01 | 5,780,151 |
| NODE02 | 5,752,087 |
| NODE03 | 5,728,678 |
| NODE04 | 5,774,487 |
| NODE05 | 5,791,586 |
| NODE06 | 5,748,113 |
| NODE07 | 5,743,581 |
| NODE08 | 5,733,050 |
| NODE09 | 5,751,458 |
| NODE10 | 5,749,842 |
| ssj_ops@100% | 57,553,033 |
| ssj_ops@100% per Host | 5,755,303 |
| ssj_ops@100% per JVM | 1,438,826 |
| Target Load | Actual Load | ssj_ops | |
|---|---|---|---|
| Target | Actual | ||
| Calibration 1 | 5,785,044 | ||
| Calibration 2 | 5,789,322 | ||
| Calibration 3 | 5,799,717 | ||
| ssj_ops@calibrated=5,794,520 | |||
| 100% | 99.8% | 5,794,520 | 5,780,151 |
| 90% | 90.1% | 5,215,068 | 5,218,414 |
| 80% | 80.1% | 4,635,616 | 4,639,854 |
| 70% | 70.0% | 4,056,164 | 4,055,200 |
| 60% | 60.0% | 3,476,712 | 3,479,386 |
| 50% | 50.1% | 2,897,260 | 2,901,418 |
| 40% | 40.0% | 2,317,808 | 2,320,433 |
| 30% | 30.0% | 1,738,356 | 1,739,631 |
| 20% | 20.0% | 1,158,904 | 1,158,046 |
| 10% | 10.0% | 579,452 | 580,242 |
| Active Idle | 0 | 0 | |

| Target Load | Actual Load | ssj_ops | |
|---|---|---|---|
| Target | Actual | ||
| Calibration 1 | 5,763,911 | ||
| Calibration 2 | 5,761,857 | ||
| Calibration 3 | 5,768,047 | ||
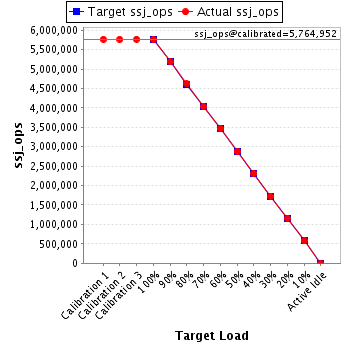
| ssj_ops@calibrated=5,764,952 | |||
| 100% | 99.8% | 5,764,952 | 5,752,087 |
| 90% | 89.9% | 5,188,457 | 5,183,199 |
| 80% | 80.2% | 4,611,961 | 4,621,573 |
| 70% | 70.0% | 4,035,466 | 4,035,249 |
| 60% | 60.1% | 3,458,971 | 3,464,368 |
| 50% | 50.0% | 2,882,476 | 2,880,214 |
| 40% | 40.1% | 2,305,981 | 2,311,832 |
| 30% | 30.0% | 1,729,486 | 1,728,309 |
| 20% | 20.1% | 1,152,990 | 1,158,336 |
| 10% | 10.0% | 576,495 | 575,608 |
| Active Idle | 0 | 0 | |
| Target Load | Actual Load | ssj_ops | |
|---|---|---|---|
| Target | Actual | ||
| Calibration 1 | 5,753,727 | ||
| Calibration 2 | 5,746,952 | ||
| Calibration 3 | 5,749,398 | ||
| ssj_ops@calibrated=5,748,175 | |||
| 100% | 99.7% | 5,748,175 | 5,728,678 |
| 90% | 90.0% | 5,173,357 | 5,172,959 |
| 80% | 80.1% | 4,598,540 | 4,604,802 |
| 70% | 70.1% | 4,023,722 | 4,029,112 |
| 60% | 60.0% | 3,448,905 | 3,451,542 |
| 50% | 50.0% | 2,874,087 | 2,876,740 |
| 40% | 39.9% | 2,299,270 | 2,296,006 |
| 30% | 30.0% | 1,724,452 | 1,725,557 |
| 20% | 20.0% | 1,149,635 | 1,149,712 |
| 10% | 10.0% | 574,817 | 575,386 |
| Active Idle | 0 | 0 | |

| Target Load | Actual Load | ssj_ops | |
|---|---|---|---|
| Target | Actual | ||
| Calibration 1 | 5,797,422 | ||
| Calibration 2 | 5,787,131 | ||
| Calibration 3 | 5,795,907 | ||
| ssj_ops@calibrated=5,791,519 | |||
| 100% | 99.7% | 5,791,519 | 5,774,487 |
| 90% | 90.0% | 5,212,367 | 5,213,967 |
| 80% | 80.0% | 4,633,215 | 4,634,701 |
| 70% | 70.1% | 4,054,063 | 4,059,191 |
| 60% | 60.0% | 3,474,911 | 3,474,611 |
| 50% | 50.0% | 2,895,760 | 2,896,255 |
| 40% | 40.0% | 2,316,608 | 2,318,390 |
| 30% | 30.0% | 1,737,456 | 1,736,475 |
| 20% | 20.1% | 1,158,304 | 1,161,717 |
| 10% | 10.0% | 579,152 | 577,761 |
| Active Idle | 0 | 0 | |

| Target Load | Actual Load | ssj_ops | |
|---|---|---|---|
| Target | Actual | ||
| Calibration 1 | 5,814,704 | ||
| Calibration 2 | 5,811,134 | ||
| Calibration 3 | 5,814,396 | ||
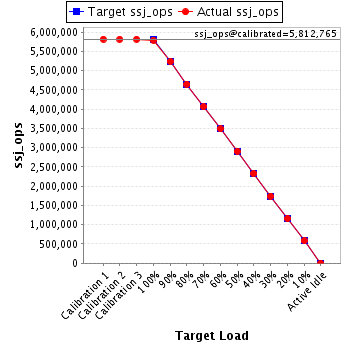
| ssj_ops@calibrated=5,812,765 | |||
| 100% | 99.6% | 5,812,765 | 5,791,586 |
| 90% | 90.1% | 5,231,488 | 5,237,921 |
| 80% | 80.0% | 4,650,212 | 4,648,163 |
| 70% | 69.9% | 4,068,935 | 4,062,140 |
| 60% | 59.9% | 3,487,659 | 3,484,352 |
| 50% | 50.1% | 2,906,382 | 2,909,712 |
| 40% | 40.0% | 2,325,106 | 2,325,676 |
| 30% | 30.0% | 1,743,829 | 1,743,928 |
| 20% | 20.0% | 1,162,553 | 1,160,924 |
| 10% | 10.0% | 581,276 | 582,832 |
| Active Idle | 0 | 0 | |
| Target Load | Actual Load | ssj_ops | |
|---|---|---|---|
| Target | Actual | ||
| Calibration 1 | 5,767,791 | ||
| Calibration 2 | 5,762,479 | ||
| Calibration 3 | 5,768,439 | ||
| ssj_ops@calibrated=5,765,459 | |||
| 100% | 99.7% | 5,765,459 | 5,748,113 |
| 90% | 90.1% | 5,188,913 | 5,195,571 |
| 80% | 80.0% | 4,612,367 | 4,614,542 |
| 70% | 70.0% | 4,035,821 | 4,033,115 |
| 60% | 60.0% | 3,459,275 | 3,459,948 |
| 50% | 50.0% | 2,882,729 | 2,882,427 |
| 40% | 40.0% | 2,306,184 | 2,306,711 |
| 30% | 30.0% | 1,729,638 | 1,728,135 |
| 20% | 20.0% | 1,153,092 | 1,155,423 |
| 10% | 10.0% | 576,546 | 574,331 |
| Active Idle | 0 | 0 | |

| Target Load | Actual Load | ssj_ops | |
|---|---|---|---|
| Target | Actual | ||
| Calibration 1 | 5,766,564 | ||
| Calibration 2 | 5,756,169 | ||
| Calibration 3 | 5,761,111 | ||
| ssj_ops@calibrated=5,758,640 | |||
| 100% | 99.7% | 5,758,640 | 5,743,581 |
| 90% | 90.0% | 5,182,776 | 5,182,202 |
| 80% | 79.9% | 4,606,912 | 4,603,686 |
| 70% | 69.9% | 4,031,048 | 4,027,303 |
| 60% | 60.0% | 3,455,184 | 3,453,271 |
| 50% | 49.9% | 2,879,320 | 2,874,865 |
| 40% | 40.0% | 2,303,456 | 2,303,985 |
| 30% | 30.0% | 1,727,592 | 1,727,865 |
| 20% | 20.0% | 1,151,728 | 1,151,343 |
| 10% | 10.0% | 575,864 | 576,704 |
| Active Idle | 0 | 0 | |

| Target Load | Actual Load | ssj_ops | |
|---|---|---|---|
| Target | Actual | ||
| Calibration 1 | 5,747,044 | ||
| Calibration 2 | 5,745,687 | ||
| Calibration 3 | 5,756,708 | ||
| ssj_ops@calibrated=5,751,198 | |||
| 100% | 99.7% | 5,751,198 | 5,733,050 |
| 90% | 90.1% | 5,176,078 | 5,184,699 |
| 80% | 80.0% | 4,600,958 | 4,600,995 |
| 70% | 69.9% | 4,025,838 | 4,021,577 |
| 60% | 60.1% | 3,450,719 | 3,456,319 |
| 50% | 49.9% | 2,875,599 | 2,868,055 |
| 40% | 40.0% | 2,300,479 | 2,300,670 |
| 30% | 30.0% | 1,725,359 | 1,722,553 |
| 20% | 20.1% | 1,150,240 | 1,154,901 |
| 10% | 10.0% | 575,120 | 574,825 |
| Active Idle | 0 | 0 | |

| Target Load | Actual Load | ssj_ops | |
|---|---|---|---|
| Target | Actual | ||
| Calibration 1 | 5,767,596 | ||
| Calibration 2 | 5,760,573 | ||
| Calibration 3 | 5,773,948 | ||
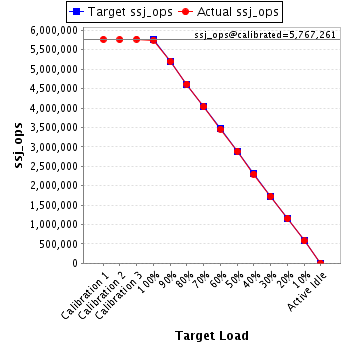
| ssj_ops@calibrated=5,767,261 | |||
| 100% | 99.7% | 5,767,261 | 5,751,458 |
| 90% | 90.2% | 5,190,535 | 5,200,499 |
| 80% | 80.0% | 4,613,809 | 4,615,663 |
| 70% | 69.9% | 4,037,083 | 4,032,559 |
| 60% | 60.0% | 3,460,356 | 3,458,300 |
| 50% | 50.0% | 2,883,630 | 2,884,771 |
| 40% | 39.9% | 2,306,904 | 2,298,738 |
| 30% | 30.0% | 1,730,178 | 1,727,944 |
| 20% | 20.0% | 1,153,452 | 1,154,600 |
| 10% | 10.0% | 576,726 | 577,822 |
| Active Idle | 0 | 0 | |
| Target Load | Actual Load | ssj_ops | |
|---|---|---|---|
| Target | Actual | ||
| Calibration 1 | 5,761,518 | ||
| Calibration 2 | 5,757,756 | ||
| Calibration 3 | 5,768,565 | ||
| ssj_ops@calibrated=5,763,160 | |||
| 100% | 99.8% | 5,763,160 | 5,749,842 |
| 90% | 89.9% | 5,186,844 | 5,183,681 |
| 80% | 80.0% | 4,610,528 | 4,610,443 |
| 70% | 70.0% | 4,034,212 | 4,036,696 |
| 60% | 60.1% | 3,457,896 | 3,462,766 |
| 50% | 50.0% | 2,881,580 | 2,882,149 |
| 40% | 40.0% | 2,305,264 | 2,304,690 |
| 30% | 30.0% | 1,728,948 | 1,726,372 |
| 20% | 20.0% | 1,152,632 | 1,154,495 |
| 10% | 10.1% | 576,316 | 583,242 |
| Active Idle | 0 | 0 | |
