SPECpower_ssj2008
Host 'NODE06' Performance Report
Copyright © 2007-2019 Standard Performance Evaluation Corporation
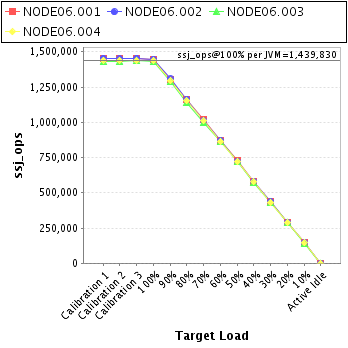
| Hewlett Packard Enterprise Synergy 480 Gen10 Compute Module | ssj_ops@100% = 5,759,319 ssj_ops@100% per JVM = 1,439,830 |
||||
| Test Sponsor: | Hewlett Packard Enterprise | SPEC License #: | 3 | Test Method: | Multi Node |
| Tested By: | Hewlett Packard Enterprise | Test Location: | Houston, TX, USA | Test Date: | Mar 26, 2019 |
| Hardware Availability: | Apr-2019 | Software Availability: | Mar-2019 | Publication: | May 8, 2019 |
| System Source: | Single Supplier | System Designation: | Server | Power Provisioning: | Line-powered |
| Target Load | Actual Load | ssj_ops | |
|---|---|---|---|
| Target | Actual | ||
| Calibration 1 | 5,778,994 | ||
| Calibration 2 | 5,772,698 | ||
| Calibration 3 | 5,779,211 | ||
| ssj_ops@calibrated=5,775,955 | |||
| 100% | 99.7% | 5,775,955 | 5,759,319 |
| 90% | 90.0% | 5,198,359 | 5,195,592 |
| 80% | 80.0% | 4,620,764 | 4,622,700 |
| 70% | 70.0% | 4,043,168 | 4,044,988 |
| 60% | 60.1% | 3,465,573 | 3,469,902 |
| 50% | 50.1% | 2,887,977 | 2,892,283 |
| 40% | 40.0% | 2,310,382 | 2,313,180 |
| 30% | 30.0% | 1,732,786 | 1,732,496 |
| 20% | 20.0% | 1,155,191 | 1,156,543 |
| 10% | 10.0% | 577,595 | 577,652 |
| Active Idle | 0 | 0 | |

| Set Identifier: | SUT |
| Set Description: | System Under Test |
| # of Identical Nodes: | 11 |
| Comment: | SUT |
| Hardware | |
|---|---|
| Hardware Vendor: | Hewlett Packard Enterprise |
| Model: | Synergy 480 Gen10 Compute Module |
| Form Factor: | 7U |
| CPU Name: | Intel Xeon Platinum 8280 @ 2.70GHz (Intel Turbo Boost Technology up to 4.00 GHz) |
| CPU Characteristics: | 28-Core, 2.70 GHz, 38.5MB L3 Cache |
| CPU Frequency (MHz): | 2700 |
| CPU(s) Enabled: | 56 cores, 2 chips, 28 cores/chip |
| Hardware Threads: | 112 (2 / core) |
| CPU(s) Orderable: | 1,2 chips |
| Primary Cache: | 32 KB I + 32 KB D on chip per core |
| Secondary Cache: | 1 MB I+D on chip per core |
| Tertiary Cache: | 39424 KB I+D on chip per chip |
| Other Cache: | None |
| Memory Amount (GB): | 192 |
| # and size of DIMM: | 12 x 16384 MB |
| Memory Details: | 12 x 16GB 2Rx8 PC4-2933Y-R; slots 1, 3, 5, 8, 10 and 12 populated in each socket |
| Power Supply Quantity and Rating (W): | None |
| Power Supply Details: | N/A |
| Disk Drive: | 1 x HPE 240GB 6G SATA M.2 SSD (875488-B21) |
| Disk Controller: | HPE Smart Array S100i SR Gen10 |
| # and type of Network Interface Cards (NICs) Installed: | 1 x HPE Synergy 3820C 10/20Gb CNA |
| NICs Enabled in Firmware / OS / Connected: | 2/2/1 |
| Network Speed (Mbit): | 1000 |
| Keyboard: | None |
| Mouse: | None |
| Monitor: | None |
| Optical Drives: | No |
| Other Hardware: | H/S: Standard |
| Software | |
|---|---|
| Power Management: | Enabled (see SUT Notes) |
| Operating System (OS): | Windows Server 2012 R2 Datacenter |
| OS Version: | Version 6.3 (Build 9600) |
| Filesystem: | NTFS |
| JVM Vendor: | Oracle Corporation |
| JVM Version: | Oracle Java HotSpot(TM) 64-Bit Server VM (build 24.80-b11, mixed mode), version 1.7.0_80 |
| JVM Command-line Options: | -server -Xmn21000m -Xms24000m -Xmx24000m -XX:SurvivorRatio=1 -XX:TargetSurvivorRatio=99 -XX:AllocatePrefetchDistance=256 -XX:AllocatePrefetchLines=4 -XX:LoopUnrollLimit=45 -XX:InitialTenuringThreshold=12 -XX:MaxTenuringThreshold=15 -XX:ParallelGCThreads=28 -XX:InlineSmallCode=3900 -XX:MaxInlineSize=270 -XX:FreqInlineSize=2500 -XX:+AggressiveOpts -XX:+UseLargePages -XX:+UseParallelOldGC |
| JVM Affinity: | start /NODE [0,1,2,3] /AFFINITY [0xFFFFFFF] |
| JVM Instances: | 4 |
| JVM Initial Heap (MB): | 24000 |
| JVM Maximum Heap (MB): | 24000 |
| JVM Address Bits: | 64 |
| Boot Firmware Version: | I42 v2.00 (02/02/2019) |
| Management Firmware Version: | 1.40 Feb 05 2019 |
| Workload Version: | SSJ 1.2.10 |
| Director Location: | Controller |
| Other Software: | HPE Service Pack for ProLiant (SPP) Version: 2019.03.0, Microsoft Windows KB4056898, KB4338815 |
| JVM Instance | ssj_ops@100% |
|---|---|
| NODE06.001 | 1,446,797 |
| NODE06.002 | 1,447,954 |
| NODE06.003 | 1,428,914 |
| NODE06.004 | 1,435,654 |
| ssj_ops@100% | 5,759,319 |
| ssj_ops@100% per JVM | 1,439,830 |
| Target Load | Actual Load | ssj_ops | |
|---|---|---|---|
| Target | Actual | ||
| Calibration 1 | 1,450,202 | ||
| Calibration 2 | 1,450,561 | ||
| Calibration 3 | 1,450,994 | ||
| ssj_ops@calibrated=1,450,778 | |||
| 100% | 99.7% | 1,450,778 | 1,446,797 |
| 90% | 89.9% | 1,305,700 | 1,304,607 |
| 80% | 80.1% | 1,160,622 | 1,162,611 |
| 70% | 70.3% | 1,015,544 | 1,020,175 |
| 60% | 60.0% | 870,467 | 870,605 |
| 50% | 50.2% | 725,389 | 728,195 |
| 40% | 40.0% | 580,311 | 580,985 |
| 30% | 30.0% | 435,233 | 435,593 |
| 20% | 20.0% | 290,156 | 290,584 |
| 10% | 10.0% | 145,078 | 144,590 |
| Active Idle | 0 | 0 | |

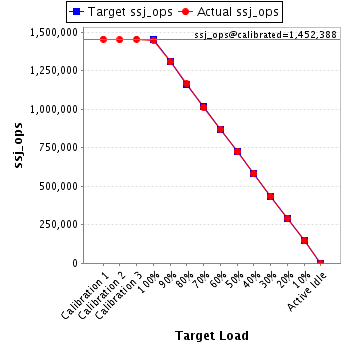
| Target Load | Actual Load | ssj_ops | |
|---|---|---|---|
| Target | Actual | ||
| Calibration 1 | 1,454,721 | ||
| Calibration 2 | 1,450,167 | ||
| Calibration 3 | 1,454,609 | ||
| ssj_ops@calibrated=1,452,388 | |||
| 100% | 99.7% | 1,452,388 | 1,447,954 |
| 90% | 90.0% | 1,307,150 | 1,307,087 |
| 80% | 80.2% | 1,161,911 | 1,164,458 |
| 70% | 69.8% | 1,016,672 | 1,013,881 |
| 60% | 60.0% | 871,433 | 871,270 |
| 50% | 49.9% | 726,194 | 725,064 |
| 40% | 40.0% | 580,955 | 581,454 |
| 30% | 30.0% | 435,717 | 436,179 |
| 20% | 20.1% | 290,478 | 291,239 |
| 10% | 10.0% | 145,239 | 145,840 |
| Active Idle | 0 | 0 | |
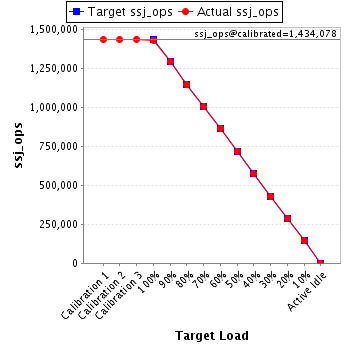
| Target Load | Actual Load | ssj_ops | |
|---|---|---|---|
| Target | Actual | ||
| Calibration 1 | 1,432,795 | ||
| Calibration 2 | 1,433,171 | ||
| Calibration 3 | 1,434,984 | ||
| ssj_ops@calibrated=1,434,078 | |||
| 100% | 99.6% | 1,434,078 | 1,428,914 |
| 90% | 90.0% | 1,290,670 | 1,290,933 |
| 80% | 79.7% | 1,147,262 | 1,143,454 |
| 70% | 69.9% | 1,003,854 | 1,001,777 |
| 60% | 60.2% | 860,447 | 862,938 |
| 50% | 50.1% | 717,039 | 718,548 |
| 40% | 40.0% | 573,631 | 573,924 |
| 30% | 30.0% | 430,223 | 429,575 |
| 20% | 20.0% | 286,816 | 286,686 |
| 10% | 10.0% | 143,408 | 143,273 |
| Active Idle | 0 | 0 | |
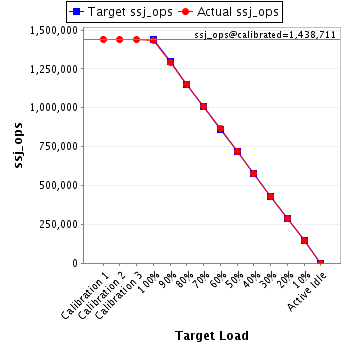
| Target Load | Actual Load | ssj_ops | |
|---|---|---|---|
| Target | Actual | ||
| Calibration 1 | 1,441,275 | ||
| Calibration 2 | 1,438,798 | ||
| Calibration 3 | 1,438,624 | ||
| ssj_ops@calibrated=1,438,711 | |||
| 100% | 99.8% | 1,438,711 | 1,435,654 |
| 90% | 89.9% | 1,294,840 | 1,292,966 |
| 80% | 80.1% | 1,150,969 | 1,152,178 |
| 70% | 70.1% | 1,007,097 | 1,009,155 |
| 60% | 60.1% | 863,226 | 865,088 |
| 50% | 50.1% | 719,355 | 720,477 |
| 40% | 40.1% | 575,484 | 576,818 |
| 30% | 30.0% | 431,613 | 431,150 |
| 20% | 20.0% | 287,742 | 288,034 |
| 10% | 10.0% | 143,871 | 143,948 |
| Active Idle | 0 | 0 | |