SPECpower_ssj2008
Host 'NODE03' Performance Report
Copyright © 2007-2019 Standard Performance Evaluation Corporation
| Hewlett Packard Enterprise Synergy 480 Gen10 Compute Module | ssj_ops@100% = 5,779,198 ssj_ops@100% per JVM = 1,444,800 |
||||
| Test Sponsor: | Hewlett Packard Enterprise | SPEC License #: | 3 | Test Method: | Multi Node |
| Tested By: | Hewlett Packard Enterprise | Test Location: | Houston, TX, USA | Test Date: | Mar 27, 2019 |
| Hardware Availability: | Apr-2019 | Software Availability: | Mar-2019 | Publication: | May 8, 2019 |
| System Source: | Single Supplier | System Designation: | Server | Power Provisioning: | Line-powered |
| Target Load | Actual Load | ssj_ops | |
|---|---|---|---|
| Target | Actual | ||
| Calibration 1 | 5,798,739 | ||
| Calibration 2 | 5,794,670 | ||
| Calibration 3 | 5,798,523 | ||
| ssj_ops@calibrated=5,796,597 | |||
| 100% | 99.7% | 5,796,597 | 5,779,198 |
| 90% | 90.0% | 5,216,937 | 5,218,026 |
| 80% | 80.0% | 4,637,277 | 4,636,733 |
| 70% | 70.1% | 4,057,618 | 4,063,284 |
| 60% | 60.1% | 3,477,958 | 3,484,201 |
| 50% | 50.0% | 2,898,298 | 2,897,165 |
| 40% | 39.9% | 2,318,639 | 2,313,711 |
| 30% | 29.9% | 1,738,979 | 1,735,003 |
| 20% | 19.9% | 1,159,319 | 1,155,445 |
| 10% | 10.0% | 579,660 | 579,919 |
| Active Idle | 0 | 0 | |

| Set Identifier: | SUT |
| Set Description: | System Under Test |
| # of Identical Nodes: | 4 |
| Comment: | SUT |
| Hardware | |
|---|---|
| Hardware Vendor: | Hewlett Packard Enterprise |
| Model: | Synergy 480 Gen10 Compute Module |
| Form Factor: | 7U |
| CPU Name: | Intel Xeon Platinum 8280 @ 2.70GHz (Intel Turbo Boost Technology up to 4.00 GHz) |
| CPU Characteristics: | 28-Core, 2.70 GHz, 38.5MB L3 Cache |
| CPU Frequency (MHz): | 2700 |
| CPU(s) Enabled: | 56 cores, 2 chips, 28 cores/chip |
| Hardware Threads: | 112 (2 / core) |
| CPU(s) Orderable: | 1,2 chips |
| Primary Cache: | 32 KB I + 32 KB D on chip per core |
| Secondary Cache: | 1 MB I+D on chip per core |
| Tertiary Cache: | 39424 KB I+D on chip per chip |
| Other Cache: | None |
| Memory Amount (GB): | 192 |
| # and size of DIMM: | 12 x 16384 MB |
| Memory Details: | 12 x 16GB 2Rx8 PC4-2933Y-R; slots 1, 3, 5, 8, 10 and 12 populated in each socket |
| Power Supply Quantity and Rating (W): | None |
| Power Supply Details: | N/A |
| Disk Drive: | 1 x HPE 240GB 6G SATA M.2 SSD (875488-B21) |
| Disk Controller: | HPE Smart Array S100i SR Gen10 |
| # and type of Network Interface Cards (NICs) Installed: | 1 x HPE Synergy 3820C 10/20Gb CNA |
| NICs Enabled in Firmware / OS / Connected: | 2/2/1 |
| Network Speed (Mbit): | 1000 |
| Keyboard: | None |
| Mouse: | None |
| Monitor: | None |
| Optical Drives: | No |
| Other Hardware: | H/S: Standard |
| Software | |
|---|---|
| Power Management: | Enabled (see SUT Notes) |
| Operating System (OS): | Windows Server 2012 R2 Datacenter |
| OS Version: | Version 6.3 (Build 9600) |
| Filesystem: | NTFS |
| JVM Vendor: | Oracle Corporation |
| JVM Version: | Oracle Java HotSpot(TM) 64-Bit Server VM (build 24.80-b11, mixed mode), version 1.7.0_80 |
| JVM Command-line Options: | -server -Xmn21000m -Xms24000m -Xmx24000m -XX:SurvivorRatio=1 -XX:TargetSurvivorRatio=99 -XX:AllocatePrefetchDistance=256 -XX:AllocatePrefetchLines=4 -XX:LoopUnrollLimit=45 -XX:InitialTenuringThreshold=12 -XX:MaxTenuringThreshold=15 -XX:ParallelGCThreads=28 -XX:InlineSmallCode=3900 -XX:MaxInlineSize=270 -XX:FreqInlineSize=2500 -XX:+AggressiveOpts -XX:+UseLargePages -XX:+UseParallelOldGC |
| JVM Affinity: | start /NODE [0,1,2,3] /AFFINITY [0xFFFFFFF] |
| JVM Instances: | 4 |
| JVM Initial Heap (MB): | 24000 |
| JVM Maximum Heap (MB): | 24000 |
| JVM Address Bits: | 64 |
| Boot Firmware Version: | I42 v2.00 (02/02/2019) |
| Management Firmware Version: | 1.40 Feb 05 2019 |
| Workload Version: | SSJ 1.2.10 |
| Director Location: | Controller |
| Other Software: | HPE Service Pack for ProLiant (SPP) Version: 2019.03.0, Microsoft Windows KB4056898, KB4338815 |
| JVM Instance | ssj_ops@100% |
|---|---|
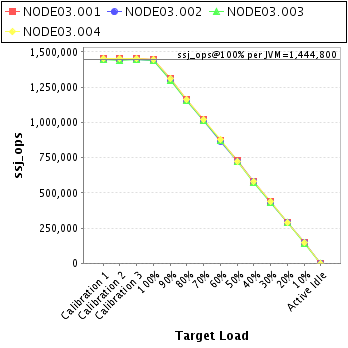
| NODE03.001 | 1,449,310 |
| NODE03.002 | 1,441,721 |
| NODE03.003 | 1,439,033 |
| NODE03.004 | 1,449,133 |
| ssj_ops@100% | 5,779,198 |
| ssj_ops@100% per JVM | 1,444,800 |
| Target Load | Actual Load | ssj_ops | |
|---|---|---|---|
| Target | Actual | ||
| Calibration 1 | 1,455,620 | ||
| Calibration 2 | 1,453,065 | ||
| Calibration 3 | 1,454,572 | ||
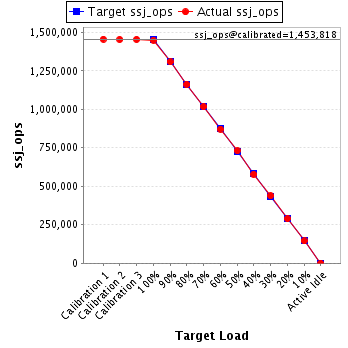
| ssj_ops@calibrated=1,453,818 | |||
| 100% | 99.7% | 1,453,818 | 1,449,310 |
| 90% | 90.0% | 1,308,437 | 1,307,892 |
| 80% | 79.9% | 1,163,055 | 1,162,030 |
| 70% | 70.0% | 1,017,673 | 1,017,019 |
| 60% | 60.0% | 872,291 | 871,909 |
| 50% | 50.2% | 726,909 | 730,339 |
| 40% | 39.8% | 581,527 | 578,143 |
| 30% | 30.1% | 436,146 | 437,357 |
| 20% | 19.9% | 290,764 | 288,703 |
| 10% | 10.0% | 145,382 | 144,871 |
| Active Idle | 0 | 0 | |
| Target Load | Actual Load | ssj_ops | |
|---|---|---|---|
| Target | Actual | ||
| Calibration 1 | 1,445,627 | ||
| Calibration 2 | 1,445,065 | ||
| Calibration 3 | 1,444,717 | ||
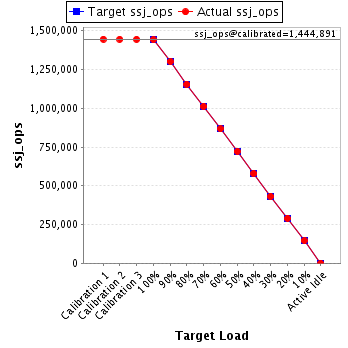
| ssj_ops@calibrated=1,444,891 | |||
| 100% | 99.8% | 1,444,891 | 1,441,721 |
| 90% | 90.1% | 1,300,402 | 1,301,508 |
| 80% | 79.9% | 1,155,913 | 1,154,544 |
| 70% | 70.1% | 1,011,424 | 1,013,279 |
| 60% | 60.0% | 866,935 | 866,413 |
| 50% | 49.9% | 722,445 | 721,658 |
| 40% | 40.0% | 577,956 | 577,869 |
| 30% | 29.9% | 433,467 | 431,852 |
| 20% | 20.1% | 288,978 | 290,173 |
| 10% | 10.1% | 144,489 | 146,167 |
| Active Idle | 0 | 0 | |
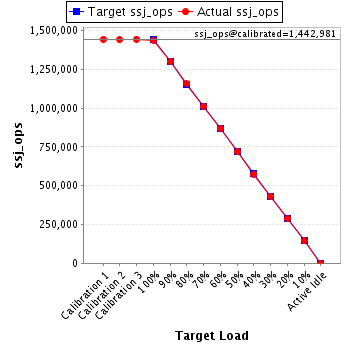
| Target Load | Actual Load | ssj_ops | |
|---|---|---|---|
| Target | Actual | ||
| Calibration 1 | 1,443,156 | ||
| Calibration 2 | 1,441,367 | ||
| Calibration 3 | 1,444,595 | ||
| ssj_ops@calibrated=1,442,981 | |||
| 100% | 99.7% | 1,442,981 | 1,439,033 |
| 90% | 90.1% | 1,298,683 | 1,299,875 |
| 80% | 80.2% | 1,154,385 | 1,157,422 |
| 70% | 70.2% | 1,010,087 | 1,012,295 |
| 60% | 60.2% | 865,789 | 868,641 |
| 50% | 49.9% | 721,491 | 719,802 |
| 40% | 39.9% | 577,192 | 575,051 |
| 30% | 29.8% | 432,894 | 430,170 |
| 20% | 19.9% | 288,596 | 286,682 |
| 10% | 10.0% | 144,298 | 143,602 |
| Active Idle | 0 | 0 | |
| Target Load | Actual Load | ssj_ops | |
|---|---|---|---|
| Target | Actual | ||
| Calibration 1 | 1,454,336 | ||
| Calibration 2 | 1,455,173 | ||
| Calibration 3 | 1,454,639 | ||
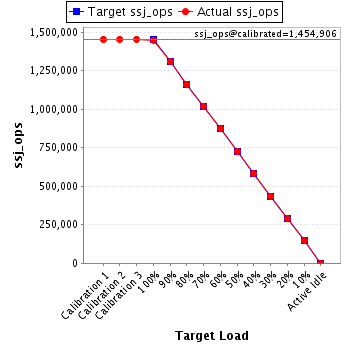
| ssj_ops@calibrated=1,454,906 | |||
| 100% | 99.6% | 1,454,906 | 1,449,133 |
| 90% | 90.0% | 1,309,416 | 1,308,752 |
| 80% | 79.9% | 1,163,925 | 1,162,736 |
| 70% | 70.2% | 1,018,434 | 1,020,691 |
| 60% | 60.3% | 872,944 | 877,238 |
| 50% | 49.9% | 727,453 | 725,366 |
| 40% | 40.0% | 581,962 | 582,648 |
| 30% | 29.9% | 436,472 | 435,624 |
| 20% | 19.9% | 290,981 | 289,886 |
| 10% | 10.0% | 145,491 | 145,279 |
| Active Idle | 0 | 0 | |