
SPECpower_ssj2008
Host 'NODE02' Performance Report
Copyright © 2007-2019 Standard Performance Evaluation Corporation
| Hewlett Packard Enterprise Synergy 480 Gen10 Compute Module | ssj_ops@100% = 5,780,358 ssj_ops@100% per JVM = 1,445,089 |
||||
| Test Sponsor: | Hewlett Packard Enterprise | SPEC License #: | 3 | Test Method: | Multi Node |
| Tested By: | Hewlett Packard Enterprise | Test Location: | Houston, TX, USA | Test Date: | Mar 27, 2019 |
| Hardware Availability: | Apr-2019 | Software Availability: | Mar-2019 | Publication: | May 8, 2019 |
| System Source: | Single Supplier | System Designation: | Server | Power Provisioning: | Line-powered |
| Target Load | Actual Load | ssj_ops | |
|---|---|---|---|
| Target | Actual | ||
| Calibration 1 | 5,799,291 | ||
| Calibration 2 | 5,794,228 | ||
| Calibration 3 | 5,795,051 | ||
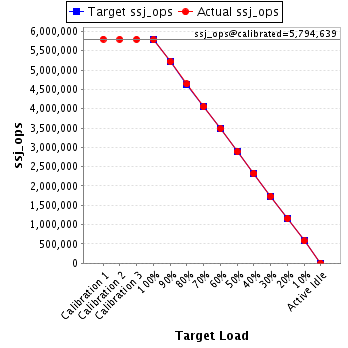
| ssj_ops@calibrated=5,794,639 | |||
| 100% | 99.8% | 5,794,639 | 5,780,358 |
| 90% | 90.1% | 5,215,175 | 5,218,657 |
| 80% | 80.1% | 4,635,711 | 4,640,149 |
| 70% | 70.0% | 4,056,247 | 4,054,153 |
| 60% | 60.1% | 3,476,783 | 3,480,280 |
| 50% | 49.8% | 2,897,320 | 2,887,667 |
| 40% | 40.1% | 2,317,856 | 2,321,476 |
| 30% | 30.0% | 1,738,392 | 1,737,206 |
| 20% | 20.0% | 1,158,928 | 1,158,013 |
| 10% | 10.0% | 579,464 | 577,814 |
| Active Idle | 0 | 0 | |
| Set Identifier: | SUT |
| Set Description: | System Under Test |
| # of Identical Nodes: | 4 |
| Comment: | SUT |
| Hardware | |
|---|---|
| Hardware Vendor: | Hewlett Packard Enterprise |
| Model: | Synergy 480 Gen10 Compute Module |
| Form Factor: | 7U |
| CPU Name: | Intel Xeon Platinum 8280 @ 2.70GHz (Intel Turbo Boost Technology up to 4.00 GHz) |
| CPU Characteristics: | 28-Core, 2.70 GHz, 38.5MB L3 Cache |
| CPU Frequency (MHz): | 2700 |
| CPU(s) Enabled: | 56 cores, 2 chips, 28 cores/chip |
| Hardware Threads: | 112 (2 / core) |
| CPU(s) Orderable: | 1,2 chips |
| Primary Cache: | 32 KB I + 32 KB D on chip per core |
| Secondary Cache: | 1 MB I+D on chip per core |
| Tertiary Cache: | 39424 KB I+D on chip per chip |
| Other Cache: | None |
| Memory Amount (GB): | 192 |
| # and size of DIMM: | 12 x 16384 MB |
| Memory Details: | 12 x 16GB 2Rx8 PC4-2933Y-R; slots 1, 3, 5, 8, 10 and 12 populated in each socket |
| Power Supply Quantity and Rating (W): | None |
| Power Supply Details: | N/A |
| Disk Drive: | 1 x HPE 240GB 6G SATA M.2 SSD (875488-B21) |
| Disk Controller: | HPE Smart Array S100i SR Gen10 |
| # and type of Network Interface Cards (NICs) Installed: | 1 x HPE Synergy 3820C 10/20Gb CNA |
| NICs Enabled in Firmware / OS / Connected: | 2/2/1 |
| Network Speed (Mbit): | 1000 |
| Keyboard: | None |
| Mouse: | None |
| Monitor: | None |
| Optical Drives: | No |
| Other Hardware: | H/S: Standard |
| Software | |
|---|---|
| Power Management: | Enabled (see SUT Notes) |
| Operating System (OS): | Windows Server 2012 R2 Datacenter |
| OS Version: | Version 6.3 (Build 9600) |
| Filesystem: | NTFS |
| JVM Vendor: | Oracle Corporation |
| JVM Version: | Oracle Java HotSpot(TM) 64-Bit Server VM (build 24.80-b11, mixed mode), version 1.7.0_80 |
| JVM Command-line Options: | -server -Xmn21000m -Xms24000m -Xmx24000m -XX:SurvivorRatio=1 -XX:TargetSurvivorRatio=99 -XX:AllocatePrefetchDistance=256 -XX:AllocatePrefetchLines=4 -XX:LoopUnrollLimit=45 -XX:InitialTenuringThreshold=12 -XX:MaxTenuringThreshold=15 -XX:ParallelGCThreads=28 -XX:InlineSmallCode=3900 -XX:MaxInlineSize=270 -XX:FreqInlineSize=2500 -XX:+AggressiveOpts -XX:+UseLargePages -XX:+UseParallelOldGC |
| JVM Affinity: | start /NODE [0,1,2,3] /AFFINITY [0xFFFFFFF] |
| JVM Instances: | 4 |
| JVM Initial Heap (MB): | 24000 |
| JVM Maximum Heap (MB): | 24000 |
| JVM Address Bits: | 64 |
| Boot Firmware Version: | I42 v2.00 (02/02/2019) |
| Management Firmware Version: | 1.40 Feb 05 2019 |
| Workload Version: | SSJ 1.2.10 |
| Director Location: | Controller |
| Other Software: | HPE Service Pack for ProLiant (SPP) Version: 2019.03.0, Microsoft Windows KB4056898, KB4338815 |
| JVM Instance | ssj_ops@100% |
|---|---|
| NODE02.001 | 1,446,921 |
| NODE02.002 | 1,432,150 |
| NODE02.003 | 1,456,382 |
| NODE02.004 | 1,444,905 |
| ssj_ops@100% | 5,780,358 |
| ssj_ops@100% per JVM | 1,445,089 |

| Target Load | Actual Load | ssj_ops | |
|---|---|---|---|
| Target | Actual | ||
| Calibration 1 | 1,452,109 | ||
| Calibration 2 | 1,453,768 | ||
| Calibration 3 | 1,450,031 | ||
| ssj_ops@calibrated=1,451,900 | |||
| 100% | 99.7% | 1,451,900 | 1,446,921 |
| 90% | 90.1% | 1,306,710 | 1,307,583 |
| 80% | 80.3% | 1,161,520 | 1,166,412 |
| 70% | 69.8% | 1,016,330 | 1,013,688 |
| 60% | 60.0% | 871,140 | 871,496 |
| 50% | 49.9% | 725,950 | 724,814 |
| 40% | 40.1% | 580,760 | 582,678 |
| 30% | 30.0% | 435,570 | 435,119 |
| 20% | 19.9% | 290,380 | 289,006 |
| 10% | 10.0% | 145,190 | 144,825 |
| Active Idle | 0 | 0 | |

| Target Load | Actual Load | ssj_ops | |
|---|---|---|---|
| Target | Actual | ||
| Calibration 1 | 1,437,771 | ||
| Calibration 2 | 1,434,464 | ||
| Calibration 3 | 1,437,418 | ||
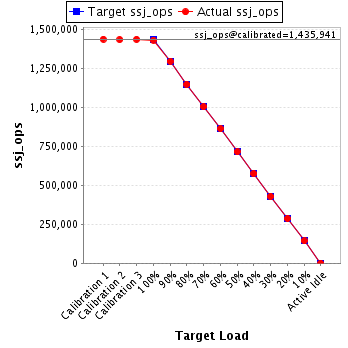
| ssj_ops@calibrated=1,435,941 | |||
| 100% | 99.7% | 1,435,941 | 1,432,150 |
| 90% | 90.3% | 1,292,347 | 1,296,242 |
| 80% | 80.0% | 1,148,753 | 1,148,091 |
| 70% | 69.9% | 1,005,159 | 1,004,227 |
| 60% | 60.1% | 861,564 | 863,054 |
| 50% | 49.8% | 717,970 | 715,019 |
| 40% | 40.0% | 574,376 | 574,180 |
| 30% | 29.9% | 430,782 | 429,074 |
| 20% | 20.0% | 287,188 | 286,577 |
| 10% | 10.0% | 143,594 | 143,479 |
| Active Idle | 0 | 0 | |
| Target Load | Actual Load | ssj_ops | |
|---|---|---|---|
| Target | Actual | ||
| Calibration 1 | 1,458,945 | ||
| Calibration 2 | 1,459,456 | ||
| Calibration 3 | 1,458,757 | ||
| ssj_ops@calibrated=1,459,106 | |||
| 100% | 99.8% | 1,459,106 | 1,456,382 |
| 90% | 90.0% | 1,313,196 | 1,312,957 |
| 80% | 80.1% | 1,167,285 | 1,169,185 |
| 70% | 70.1% | 1,021,375 | 1,023,552 |
| 60% | 60.1% | 875,464 | 876,272 |
| 50% | 49.7% | 729,553 | 725,100 |
| 40% | 40.1% | 583,643 | 585,241 |
| 30% | 30.1% | 437,732 | 438,476 |
| 20% | 20.0% | 291,821 | 291,872 |
| 10% | 9.9% | 145,911 | 144,476 |
| Active Idle | 0 | 0 | |

| Target Load | Actual Load | ssj_ops | |
|---|---|---|---|
| Target | Actual | ||
| Calibration 1 | 1,450,466 | ||
| Calibration 2 | 1,446,540 | ||
| Calibration 3 | 1,448,845 | ||
| ssj_ops@calibrated=1,447,692 | |||
| 100% | 99.8% | 1,447,692 | 1,444,905 |
| 90% | 89.9% | 1,302,923 | 1,301,875 |
| 80% | 79.9% | 1,158,154 | 1,156,461 |
| 70% | 70.0% | 1,013,385 | 1,012,685 |
| 60% | 60.1% | 868,615 | 869,458 |
| 50% | 49.9% | 723,846 | 722,733 |
| 40% | 40.0% | 579,077 | 579,378 |
| 30% | 30.0% | 434,308 | 434,538 |
| 20% | 20.1% | 289,538 | 290,559 |
| 10% | 10.0% | 144,769 | 145,035 |
| Active Idle | 0 | 0 | |
