SPECpower_ssj2008
Host 'NODE05' Performance Report
Copyright © 2007-2019 Standard Performance Evaluation Corporation
| Hewlett Packard Enterprise Synergy 480 Gen10 Compute Module | ssj_ops@100% = 5,778,010 ssj_ops@100% per JVM = 1,444,502 |
||||
| Test Sponsor: | Hewlett Packard Enterprise | SPEC License #: | 3 | Test Method: | Multi Node |
| Tested By: | Hewlett Packard Enterprise | Test Location: | Houston, TX, USA | Test Date: | Mar 27, 2019 |
| Hardware Availability: | Apr-2019 | Software Availability: | Mar-2019 | Publication: | May 8, 2019 |
| System Source: | Single Supplier | System Designation: | Server | Power Provisioning: | Line-powered |
| Target Load | Actual Load | ssj_ops | |
|---|---|---|---|
| Target | Actual | ||
| Calibration 1 | 5,796,734 | ||
| Calibration 2 | 5,798,073 | ||
| Calibration 3 | 5,795,821 | ||
| ssj_ops@calibrated=5,796,947 | |||
| 100% | 99.7% | 5,796,947 | 5,778,010 |
| 90% | 90.0% | 5,217,252 | 5,215,394 |
| 80% | 80.0% | 4,637,558 | 4,639,974 |
| 70% | 70.0% | 4,057,863 | 4,056,714 |
| 60% | 59.9% | 3,478,168 | 3,471,676 |
| 50% | 50.0% | 2,898,473 | 2,896,250 |
| 40% | 40.0% | 2,318,779 | 2,317,823 |
| 30% | 29.9% | 1,739,084 | 1,735,498 |
| 20% | 20.0% | 1,159,389 | 1,160,262 |
| 10% | 10.0% | 579,695 | 579,042 |
| Active Idle | 0 | 0 | |

| Set Identifier: | SUT |
| Set Description: | System Under Test |
| # of Identical Nodes: | 5 |
| Comment: | SUT |
| Hardware | |
|---|---|
| Hardware Vendor: | Hewlett Packard Enterprise |
| Model: | Synergy 480 Gen10 Compute Module |
| Form Factor: | 7U |
| CPU Name: | Intel Xeon Platinum 8280 @ 2.70GHz (Intel Turbo Boost Technology up to 4.00 GHz) |
| CPU Characteristics: | 28-Core, 2.70 GHz, 38.5MB L3 Cache |
| CPU Frequency (MHz): | 2700 |
| CPU(s) Enabled: | 56 cores, 2 chips, 28 cores/chip |
| Hardware Threads: | 112 (2 / core) |
| CPU(s) Orderable: | 1,2 chips |
| Primary Cache: | 32 KB I + 32 KB D on chip per core |
| Secondary Cache: | 1 MB I+D on chip per core |
| Tertiary Cache: | 39424 KB I+D on chip per chip |
| Other Cache: | None |
| Memory Amount (GB): | 192 |
| # and size of DIMM: | 12 x 16384 MB |
| Memory Details: | 12 x 16GB 2Rx8 PC4-2933Y-R; slots 1, 3, 5, 8, 10 and 12 populated in each socket |
| Power Supply Quantity and Rating (W): | None |
| Power Supply Details: | N/A |
| Disk Drive: | 1 x HPE 240GB 6G SATA M.2 SSD (875488-B21) |
| Disk Controller: | HPE Smart Array S100i SR Gen10 |
| # and type of Network Interface Cards (NICs) Installed: | 1 x HPE Synergy 3820C 10/20Gb CNA |
| NICs Enabled in Firmware / OS / Connected: | 2/2/1 |
| Network Speed (Mbit): | 1000 |
| Keyboard: | None |
| Mouse: | None |
| Monitor: | None |
| Optical Drives: | No |
| Other Hardware: | H/S: Standard |
| Software | |
|---|---|
| Power Management: | Enabled (see SUT Notes) |
| Operating System (OS): | Windows Server 2012 R2 Datacenter |
| OS Version: | Version 6.3 (Build 9600) |
| Filesystem: | NTFS |
| JVM Vendor: | Oracle Corporation |
| JVM Version: | Oracle Java HotSpot(TM) 64-Bit Server VM (build 24.80-b11, mixed mode), version 1.7.0_80 |
| JVM Command-line Options: | -server -Xmn21000m -Xms24000m -Xmx24000m -XX:SurvivorRatio=1 -XX:TargetSurvivorRatio=99 -XX:AllocatePrefetchDistance=256 -XX:AllocatePrefetchLines=4 -XX:LoopUnrollLimit=45 -XX:InitialTenuringThreshold=12 -XX:MaxTenuringThreshold=15 -XX:ParallelGCThreads=28 -XX:InlineSmallCode=3900 -XX:MaxInlineSize=270 -XX:FreqInlineSize=2500 -XX:+AggressiveOpts -XX:+UseLargePages -XX:+UseParallelOldGC |
| JVM Affinity: | start /NODE [0,1,2,3] /AFFINITY [0xFFFFFFF] |
| JVM Instances: | 4 |
| JVM Initial Heap (MB): | 24000 |
| JVM Maximum Heap (MB): | 24000 |
| JVM Address Bits: | 64 |
| Boot Firmware Version: | I42 v2.00 (02/02/2019) |
| Management Firmware Version: | 1.40 Feb 05 2019 |
| Workload Version: | SSJ 1.2.10 |
| Director Location: | Controller |
| Other Software: | HPE Service Pack for ProLiant (SPP) Version: 2019.03.0, Microsoft Windows KB4056898, KB4338815 |
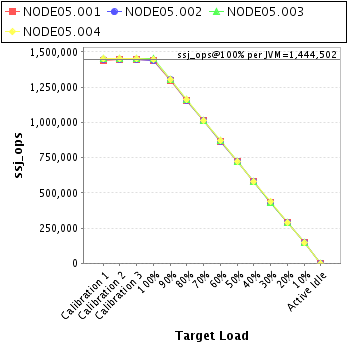
| JVM Instance | ssj_ops@100% |
|---|---|
| NODE05.001 | 1,439,328 |
| NODE05.002 | 1,440,569 |
| NODE05.003 | 1,450,786 |
| NODE05.004 | 1,447,327 |
| ssj_ops@100% | 5,778,010 |
| ssj_ops@100% per JVM | 1,444,502 |
| Target Load | Actual Load | ssj_ops | |
|---|---|---|---|
| Target | Actual | ||
| Calibration 1 | 1,442,765 | ||
| Calibration 2 | 1,446,510 | ||
| Calibration 3 | 1,446,012 | ||
| ssj_ops@calibrated=1,446,261 | |||
| 100% | 99.5% | 1,446,261 | 1,439,328 |
| 90% | 89.9% | 1,301,635 | 1,299,990 |
| 80% | 80.1% | 1,157,009 | 1,158,228 |
| 70% | 70.0% | 1,012,383 | 1,012,699 |
| 60% | 59.8% | 867,757 | 864,534 |
| 50% | 50.0% | 723,130 | 722,611 |
| 40% | 40.0% | 578,504 | 579,217 |
| 30% | 29.9% | 433,878 | 432,663 |
| 20% | 20.1% | 289,252 | 290,570 |
| 10% | 10.0% | 144,626 | 145,191 |
| Active Idle | 0 | 0 | |

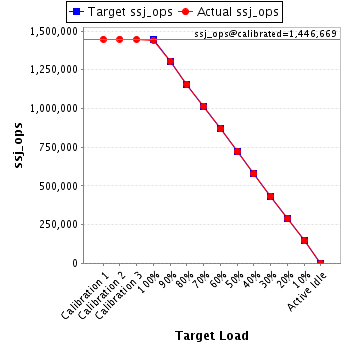
| Target Load | Actual Load | ssj_ops | |
|---|---|---|---|
| Target | Actual | ||
| Calibration 1 | 1,447,339 | ||
| Calibration 2 | 1,447,584 | ||
| Calibration 3 | 1,445,753 | ||
| ssj_ops@calibrated=1,446,669 | |||
| 100% | 99.6% | 1,446,669 | 1,440,569 |
| 90% | 90.3% | 1,302,002 | 1,305,958 |
| 80% | 79.9% | 1,157,335 | 1,156,601 |
| 70% | 70.1% | 1,012,668 | 1,013,984 |
| 60% | 60.0% | 868,001 | 867,824 |
| 50% | 50.0% | 723,334 | 722,773 |
| 40% | 39.9% | 578,668 | 577,797 |
| 30% | 30.0% | 434,001 | 433,377 |
| 20% | 19.9% | 289,334 | 288,573 |
| 10% | 10.0% | 144,667 | 144,260 |
| Active Idle | 0 | 0 | |
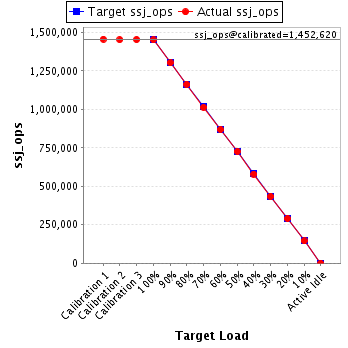
| Target Load | Actual Load | ssj_ops | |
|---|---|---|---|
| Target | Actual | ||
| Calibration 1 | 1,456,050 | ||
| Calibration 2 | 1,452,218 | ||
| Calibration 3 | 1,453,023 | ||
| ssj_ops@calibrated=1,452,620 | |||
| 100% | 99.9% | 1,452,620 | 1,450,786 |
| 90% | 89.7% | 1,307,358 | 1,302,921 |
| 80% | 80.0% | 1,162,096 | 1,162,215 |
| 70% | 69.8% | 1,016,834 | 1,013,951 |
| 60% | 59.8% | 871,572 | 868,734 |
| 50% | 50.0% | 726,310 | 725,953 |
| 40% | 39.9% | 581,048 | 579,963 |
| 30% | 29.9% | 435,786 | 434,378 |
| 20% | 20.0% | 290,524 | 289,811 |
| 10% | 10.0% | 145,262 | 144,815 |
| Active Idle | 0 | 0 | |
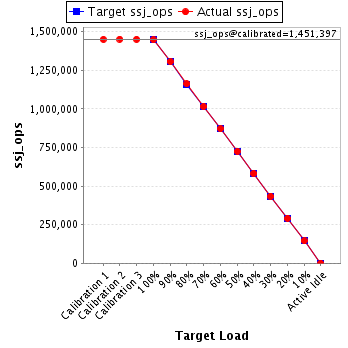
| Target Load | Actual Load | ssj_ops | |
|---|---|---|---|
| Target | Actual | ||
| Calibration 1 | 1,450,580 | ||
| Calibration 2 | 1,451,760 | ||
| Calibration 3 | 1,451,033 | ||
| ssj_ops@calibrated=1,451,397 | |||
| 100% | 99.7% | 1,451,397 | 1,447,327 |
| 90% | 90.0% | 1,306,257 | 1,306,525 |
| 80% | 80.1% | 1,161,117 | 1,162,930 |
| 70% | 70.0% | 1,015,978 | 1,016,080 |
| 60% | 60.0% | 870,838 | 870,583 |
| 50% | 49.9% | 725,698 | 724,913 |
| 40% | 40.0% | 580,559 | 580,845 |
| 30% | 30.0% | 435,419 | 435,080 |
| 20% | 20.1% | 290,279 | 291,308 |
| 10% | 10.0% | 145,140 | 144,775 |
| Active Idle | 0 | 0 | |