SPECpower_ssj2008
Host 'NODE01' Performance Report
Copyright © 2007-2019 Standard Performance Evaluation Corporation
| Hewlett Packard Enterprise Synergy 480 Gen10 Compute Module | ssj_ops@100% = 5,739,811 ssj_ops@100% per JVM = 1,434,953 |
||||
| Test Sponsor: | Hewlett Packard Enterprise | SPEC License #: | 3 | Test Method: | Multi Node |
| Tested By: | Hewlett Packard Enterprise | Test Location: | Houston, TX, USA | Test Date: | Mar 27, 2019 |
| Hardware Availability: | Apr-2019 | Software Availability: | Mar-2019 | Publication: | May 8, 2019 |
| System Source: | Single Supplier | System Designation: | Server | Power Provisioning: | Line-powered |
| Target Load | Actual Load | ssj_ops | |
|---|---|---|---|
| Target | Actual | ||
| Calibration 1 | 5,763,382 | ||
| Calibration 2 | 5,755,880 | ||
| Calibration 3 | 5,760,089 | ||
| ssj_ops@calibrated=5,757,984 | |||
| 100% | 99.7% | 5,757,984 | 5,739,811 |
| 90% | 90.1% | 5,182,186 | 5,187,060 |
| 80% | 80.0% | 4,606,387 | 4,604,227 |
| 70% | 70.0% | 4,030,589 | 4,027,764 |
| 60% | 60.1% | 3,454,791 | 3,460,897 |
| 50% | 50.0% | 2,878,992 | 2,881,278 |
| 40% | 40.0% | 2,303,194 | 2,302,671 |
| 30% | 30.0% | 1,727,395 | 1,727,672 |
| 20% | 20.0% | 1,151,597 | 1,153,880 |
| 10% | 10.0% | 575,798 | 577,886 |
| Active Idle | 0 | 0 | |

| Set Identifier: | SUT |
| Set Description: | System Under Test |
| # of Identical Nodes: | 5 |
| Comment: | SUT |
| Hardware | |
|---|---|
| Hardware Vendor: | Hewlett Packard Enterprise |
| Model: | Synergy 480 Gen10 Compute Module |
| Form Factor: | 7U |
| CPU Name: | Intel Xeon Platinum 8280 @ 2.70GHz (Intel Turbo Boost Technology up to 4.00 GHz) |
| CPU Characteristics: | 28-Core, 2.70 GHz, 38.5MB L3 Cache |
| CPU Frequency (MHz): | 2700 |
| CPU(s) Enabled: | 56 cores, 2 chips, 28 cores/chip |
| Hardware Threads: | 112 (2 / core) |
| CPU(s) Orderable: | 1,2 chips |
| Primary Cache: | 32 KB I + 32 KB D on chip per core |
| Secondary Cache: | 1 MB I+D on chip per core |
| Tertiary Cache: | 39424 KB I+D on chip per chip |
| Other Cache: | None |
| Memory Amount (GB): | 192 |
| # and size of DIMM: | 12 x 16384 MB |
| Memory Details: | 12 x 16GB 2Rx8 PC4-2933Y-R; slots 1, 3, 5, 8, 10 and 12 populated in each socket |
| Power Supply Quantity and Rating (W): | None |
| Power Supply Details: | N/A |
| Disk Drive: | 1 x HPE 240GB 6G SATA M.2 SSD (875488-B21) |
| Disk Controller: | HPE Smart Array S100i SR Gen10 |
| # and type of Network Interface Cards (NICs) Installed: | 1 x HPE Synergy 3820C 10/20Gb CNA |
| NICs Enabled in Firmware / OS / Connected: | 2/2/1 |
| Network Speed (Mbit): | 1000 |
| Keyboard: | None |
| Mouse: | None |
| Monitor: | None |
| Optical Drives: | No |
| Other Hardware: | H/S: Standard |
| Software | |
|---|---|
| Power Management: | Enabled (see SUT Notes) |
| Operating System (OS): | Windows Server 2012 R2 Datacenter |
| OS Version: | Version 6.3 (Build 9600) |
| Filesystem: | NTFS |
| JVM Vendor: | Oracle Corporation |
| JVM Version: | Oracle Java HotSpot(TM) 64-Bit Server VM (build 24.80-b11, mixed mode), version 1.7.0_80 |
| JVM Command-line Options: | -server -Xmn21000m -Xms24000m -Xmx24000m -XX:SurvivorRatio=1 -XX:TargetSurvivorRatio=99 -XX:AllocatePrefetchDistance=256 -XX:AllocatePrefetchLines=4 -XX:LoopUnrollLimit=45 -XX:InitialTenuringThreshold=12 -XX:MaxTenuringThreshold=15 -XX:ParallelGCThreads=28 -XX:InlineSmallCode=3900 -XX:MaxInlineSize=270 -XX:FreqInlineSize=2500 -XX:+AggressiveOpts -XX:+UseLargePages -XX:+UseParallelOldGC |
| JVM Affinity: | start /NODE [0,1,2,3] /AFFINITY [0xFFFFFFF] |
| JVM Instances: | 4 |
| JVM Initial Heap (MB): | 24000 |
| JVM Maximum Heap (MB): | 24000 |
| JVM Address Bits: | 64 |
| Boot Firmware Version: | I42 v2.00 (02/02/2019) |
| Management Firmware Version: | 1.40 Feb 05 2019 |
| Workload Version: | SSJ 1.2.10 |
| Director Location: | Controller |
| Other Software: | HPE Service Pack for ProLiant (SPP) Version: 2019.03.0, Microsoft Windows KB4056898, KB4338815 |
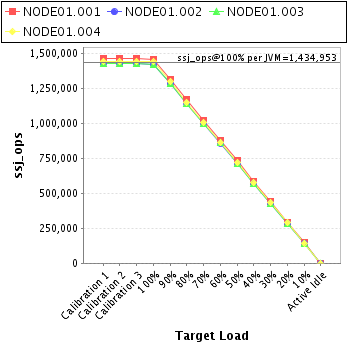
| JVM Instance | ssj_ops@100% |
|---|---|
| NODE01.001 | 1,457,718 |
| NODE01.002 | 1,421,583 |
| NODE01.003 | 1,422,142 |
| NODE01.004 | 1,438,367 |
| ssj_ops@100% | 5,739,811 |
| ssj_ops@100% per JVM | 1,434,953 |
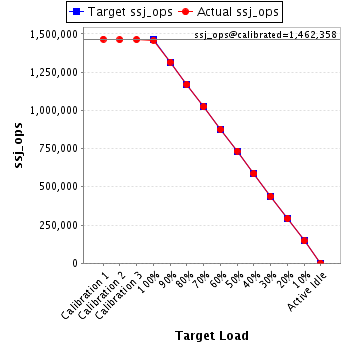
| Target Load | Actual Load | ssj_ops | |
|---|---|---|---|
| Target | Actual | ||
| Calibration 1 | 1,465,489 | ||
| Calibration 2 | 1,461,826 | ||
| Calibration 3 | 1,462,889 | ||
| ssj_ops@calibrated=1,462,358 | |||
| 100% | 99.7% | 1,462,358 | 1,457,718 |
| 90% | 90.0% | 1,316,122 | 1,316,124 |
| 80% | 79.9% | 1,169,886 | 1,169,033 |
| 70% | 70.0% | 1,023,650 | 1,023,388 |
| 60% | 59.9% | 877,415 | 875,488 |
| 50% | 50.2% | 731,179 | 734,006 |
| 40% | 40.0% | 584,943 | 585,608 |
| 30% | 30.0% | 438,707 | 438,600 |
| 20% | 20.0% | 292,472 | 292,460 |
| 10% | 10.0% | 146,236 | 146,523 |
| Active Idle | 0 | 0 | |
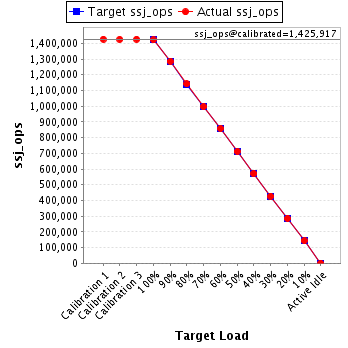
| Target Load | Actual Load | ssj_ops | |
|---|---|---|---|
| Target | Actual | ||
| Calibration 1 | 1,426,661 | ||
| Calibration 2 | 1,425,246 | ||
| Calibration 3 | 1,426,588 | ||
| ssj_ops@calibrated=1,425,917 | |||
| 100% | 99.7% | 1,425,917 | 1,421,583 |
| 90% | 90.2% | 1,283,325 | 1,285,741 |
| 80% | 80.1% | 1,140,734 | 1,141,725 |
| 70% | 69.9% | 998,142 | 996,892 |
| 60% | 60.2% | 855,550 | 858,447 |
| 50% | 50.0% | 712,959 | 712,280 |
| 40% | 40.0% | 570,367 | 570,223 |
| 30% | 30.0% | 427,775 | 427,755 |
| 20% | 20.0% | 285,183 | 285,824 |
| 10% | 10.0% | 142,592 | 142,986 |
| Active Idle | 0 | 0 | |
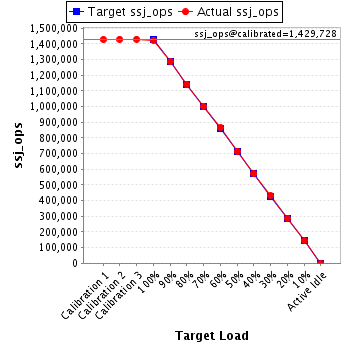
| Target Load | Actual Load | ssj_ops | |
|---|---|---|---|
| Target | Actual | ||
| Calibration 1 | 1,427,745 | ||
| Calibration 2 | 1,429,355 | ||
| Calibration 3 | 1,430,101 | ||
| ssj_ops@calibrated=1,429,728 | |||
| 100% | 99.5% | 1,429,728 | 1,422,142 |
| 90% | 90.0% | 1,286,755 | 1,287,143 |
| 80% | 80.0% | 1,143,782 | 1,143,702 |
| 70% | 70.0% | 1,000,810 | 1,000,610 |
| 60% | 60.5% | 857,837 | 865,023 |
| 50% | 50.1% | 714,864 | 715,708 |
| 40% | 40.0% | 571,891 | 572,041 |
| 30% | 30.1% | 428,918 | 430,235 |
| 20% | 20.1% | 285,946 | 287,340 |
| 10% | 10.1% | 142,973 | 143,738 |
| Active Idle | 0 | 0 | |
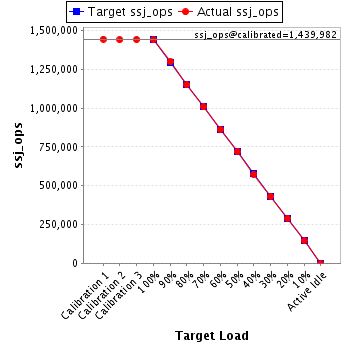
| Target Load | Actual Load | ssj_ops | |
|---|---|---|---|
| Target | Actual | ||
| Calibration 1 | 1,443,488 | ||
| Calibration 2 | 1,439,452 | ||
| Calibration 3 | 1,440,511 | ||
| ssj_ops@calibrated=1,439,982 | |||
| 100% | 99.9% | 1,439,982 | 1,438,367 |
| 90% | 90.1% | 1,295,983 | 1,298,053 |
| 80% | 79.8% | 1,151,985 | 1,149,766 |
| 70% | 69.9% | 1,007,987 | 1,006,874 |
| 60% | 59.9% | 863,989 | 861,939 |
| 50% | 50.0% | 719,991 | 719,284 |
| 40% | 39.9% | 575,993 | 574,799 |
| 30% | 29.9% | 431,994 | 431,083 |
| 20% | 20.0% | 287,996 | 288,256 |
| 10% | 10.0% | 143,998 | 144,638 |
| Active Idle | 0 | 0 | |