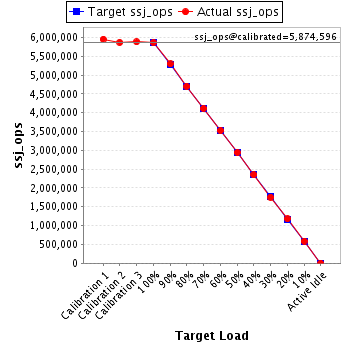
| Target Load |
Actual Load |
ssj_ops |
| Target |
Actual |
| Calibration 1 |
|
|
5,953,983 |
| Calibration 2 |
|
|
5,869,009 |
| Calibration 3 |
|
|
5,880,182 |
| ssj_ops@calibrated=5,874,596 |
| 100% |
99.8% |
5,874,596 |
5,862,280 |
| 90% |
90.1% |
5,287,136 |
5,295,010 |
| 80% |
80.0% |
4,699,677 |
4,701,917 |
| 70% |
70.1% |
4,112,217 |
4,115,478 |
| 60% |
60.0% |
3,524,757 |
3,524,952 |
| 50% |
50.1% |
2,937,298 |
2,943,481 |
| 40% |
40.0% |
2,349,838 |
2,349,333 |
| 30% |
29.9% |
1,762,379 |
1,758,595 |
| 20% |
20.0% |
1,174,919 |
1,177,464 |
| 10% |
10.0% |
587,460 |
588,329 |
| Active Idle |
|
0 |
0 |
| Hardware |
| Hardware Vendor: |
Huawei Technologies Co., Ltd |
| Model: |
Fusion Server 1288H V5 |
| Form Factor: |
1U |
| CPU Name: |
Intel Xeon Platinum 8280 |
| CPU Characteristics: |
28-Core, 2.7GHz, 38.5MB L3 Cache |
| CPU Frequency (MHz): |
2700 |
| CPU(s) Enabled: |
56 cores, 2 chips, 28 cores/chip |
| Hardware Threads: |
112 (2 / core) |
| CPU(s) Orderable: |
1,2 chips |
| Primary Cache: |
32 KB I + 32 KB D on chip per core |
| Secondary Cache: |
1 MB I+D on chip per core |
| Tertiary Cache: |
39424 KB I+D on chip per chip |
| Other Cache: |
None |
| Memory Amount (GB): |
192 |
| # and size of DIMM: |
12 x 16 GB |
| Memory Details: |
12 x 16GB 2Rx8 PC4-2933Y ECC RDIMM;slots DIMM000, DIMM010, DIMM020, DIMM030,DIMM040, DIMM050, DIMM100, DIMM110, DIMM120, DIMM130, DIMM140, and DIMM150 populated |
| Power Supply Quantity and Rating (W): |
1 x 550 |
| Power Supply Details: |
Huawei P/N 02312DEP |
| Disk Drive: |
1 x 960GB SSD 2.5" SATA Huawei P/N 02312DXT |
| Disk Controller: |
Integrated SATA controller |
| # and type of Network Interface Cards (NICs) Installed: |
LOM with 2 x 10GbE + 2 x GbE Intel X722 Ethernet controller |
| NICs Enabled in Firmware / OS / Connected: |
4/4/1 |
| Network Speed (Mbit): |
1000 |
| Keyboard: |
None |
| Mouse: |
None |
| Monitor: |
None |
| Optical Drives: |
No |
| Other Hardware: |
None |
| JVM Instance |
ssj_ops@100% |
| localhost.localdomain.001 |
103,268 |
| localhost.localdomain.002 |
104,873 |
| localhost.localdomain.003 |
105,469 |
| localhost.localdomain.004 |
105,188 |
| localhost.localdomain.005 |
104,637 |
| localhost.localdomain.006 |
104,505 |
| localhost.localdomain.007 |
105,356 |
| localhost.localdomain.008 |
105,935 |
| localhost.localdomain.009 |
106,118 |
| localhost.localdomain.010 |
105,666 |
| localhost.localdomain.011 |
103,366 |
| localhost.localdomain.012 |
104,004 |
| localhost.localdomain.013 |
104,499 |
| localhost.localdomain.014 |
103,816 |
| localhost.localdomain.015 |
104,323 |
| localhost.localdomain.016 |
105,408 |
| localhost.localdomain.017 |
104,115 |
| localhost.localdomain.018 |
104,570 |
| localhost.localdomain.019 |
103,805 |
| localhost.localdomain.020 |
104,492 |
| localhost.localdomain.021 |
104,815 |
| localhost.localdomain.022 |
104,108 |
| localhost.localdomain.023 |
106,181 |
| localhost.localdomain.024 |
105,124 |
| localhost.localdomain.025 |
106,842 |
| localhost.localdomain.026 |
104,451 |
| localhost.localdomain.027 |
103,353 |
| localhost.localdomain.028 |
104,491 |
| localhost.localdomain.029 |
105,622 |
| localhost.localdomain.030 |
104,007 |
| localhost.localdomain.031 |
105,053 |
| localhost.localdomain.032 |
105,081 |
| localhost.localdomain.033 |
104,470 |
| localhost.localdomain.034 |
106,066 |
| localhost.localdomain.035 |
105,279 |
| localhost.localdomain.036 |
104,941 |
| localhost.localdomain.037 |
105,082 |
| localhost.localdomain.038 |
103,806 |
| localhost.localdomain.039 |
104,460 |
| localhost.localdomain.040 |
102,938 |
| localhost.localdomain.041 |
105,042 |
| localhost.localdomain.042 |
105,589 |
| localhost.localdomain.043 |
105,572 |
| localhost.localdomain.044 |
104,068 |
| localhost.localdomain.045 |
104,306 |
| localhost.localdomain.046 |
104,353 |
| localhost.localdomain.047 |
104,094 |
| localhost.localdomain.048 |
104,462 |
| localhost.localdomain.049 |
104,257 |
| localhost.localdomain.050 |
103,552 |
| localhost.localdomain.051 |
105,027 |
| localhost.localdomain.052 |
104,355 |
| localhost.localdomain.053 |
105,002 |
| localhost.localdomain.054 |
105,362 |
| localhost.localdomain.055 |
103,965 |
| localhost.localdomain.056 |
103,695 |
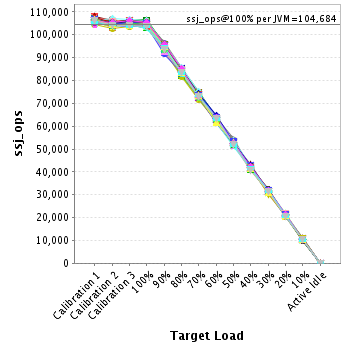
| ssj_ops@100% |
5,862,280 |
| ssj_ops@100% per JVM |
104,684 |
JVM 'localhost.localdomain.001' Scores:
| Target Load |
Actual Load |
ssj_ops |
| Target |
Actual |
| Calibration 1 |
|
|
105,749 |
| Calibration 2 |
|
|
103,387 |
| Calibration 3 |
|
|
105,177 |
| ssj_ops@calibrated=104,282 |
| 100% |
99.0% |
104,282 |
103,268 |
| 90% |
89.3% |
93,854 |
93,104 |
| 80% |
80.5% |
83,426 |
83,918 |
| 70% |
70.3% |
72,998 |
73,316 |
| 60% |
60.5% |
62,569 |
63,087 |
| 50% |
50.3% |
52,141 |
52,483 |
| 40% |
39.4% |
41,713 |
41,098 |
| 30% |
29.9% |
31,285 |
31,202 |
| 20% |
19.6% |
20,856 |
20,421 |
| 10% |
9.8% |
10,428 |
10,237 |
| Active Idle |
|
0 |
0 |
JVM 'localhost.localdomain.002' Scores:
| Target Load |
Actual Load |
ssj_ops |
| Target |
Actual |
| Calibration 1 |
|
|
106,757 |
| Calibration 2 |
|
|
104,754 |
| Calibration 3 |
|
|
105,189 |
| ssj_ops@calibrated=104,972 |
| 100% |
99.9% |
104,972 |
104,873 |
| 90% |
91.5% |
94,474 |
96,100 |
| 80% |
79.5% |
83,977 |
83,433 |
| 70% |
70.0% |
73,480 |
73,528 |
| 60% |
60.5% |
62,983 |
63,512 |
| 50% |
50.7% |
52,486 |
53,179 |
| 40% |
39.5% |
41,989 |
41,475 |
| 30% |
30.1% |
31,491 |
31,596 |
| 20% |
20.0% |
20,994 |
20,967 |
| 10% |
9.7% |
10,497 |
10,217 |
| Active Idle |
|
0 |
0 |
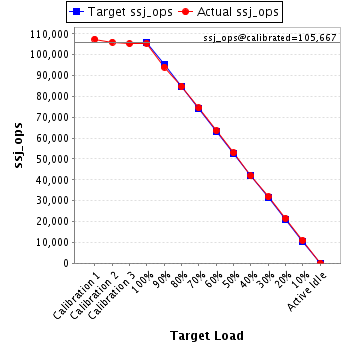
JVM 'localhost.localdomain.003' Scores:
| Target Load |
Actual Load |
ssj_ops |
| Target |
Actual |
| Calibration 1 |
|
|
107,447 |
| Calibration 2 |
|
|
106,038 |
| Calibration 3 |
|
|
105,297 |
| ssj_ops@calibrated=105,667 |
| 100% |
99.8% |
105,667 |
105,469 |
| 90% |
89.0% |
95,101 |
94,083 |
| 80% |
80.3% |
84,534 |
84,826 |
| 70% |
70.5% |
73,967 |
74,457 |
| 60% |
60.1% |
63,400 |
63,518 |
| 50% |
50.1% |
52,834 |
52,933 |
| 40% |
39.6% |
42,267 |
41,868 |
| 30% |
30.1% |
31,700 |
31,837 |
| 20% |
20.4% |
21,133 |
21,596 |
| 10% |
10.4% |
10,567 |
10,969 |
| Active Idle |
|
0 |
0 |
JVM 'localhost.localdomain.004' Scores:
| Target Load |
Actual Load |
ssj_ops |
| Target |
Actual |
| Calibration 1 |
|
|
105,936 |
| Calibration 2 |
|
|
105,719 |
| Calibration 3 |
|
|
105,070 |
| ssj_ops@calibrated=105,394 |
| 100% |
99.8% |
105,394 |
105,188 |
| 90% |
90.4% |
94,855 |
95,288 |
| 80% |
79.3% |
84,315 |
83,629 |
| 70% |
70.7% |
73,776 |
74,497 |
| 60% |
60.5% |
63,237 |
63,792 |
| 50% |
50.5% |
52,697 |
53,175 |
| 40% |
39.4% |
42,158 |
41,563 |
| 30% |
30.1% |
31,618 |
31,766 |
| 20% |
19.7% |
21,079 |
20,741 |
| 10% |
9.9% |
10,539 |
10,450 |
| Active Idle |
|
0 |
0 |
JVM 'localhost.localdomain.005' Scores:
| Target Load |
Actual Load |
ssj_ops |
| Target |
Actual |
| Calibration 1 |
|
|
106,621 |
| Calibration 2 |
|
|
105,293 |
| Calibration 3 |
|
|
105,206 |
| ssj_ops@calibrated=105,250 |
| 100% |
99.4% |
105,250 |
104,637 |
| 90% |
89.9% |
94,725 |
94,659 |
| 80% |
79.2% |
84,200 |
83,352 |
| 70% |
70.1% |
73,675 |
73,731 |
| 60% |
59.6% |
63,150 |
62,734 |
| 50% |
50.4% |
52,625 |
53,058 |
| 40% |
40.0% |
42,100 |
42,096 |
| 30% |
29.7% |
31,575 |
31,212 |
| 20% |
20.0% |
21,050 |
21,033 |
| 10% |
9.6% |
10,525 |
10,150 |
| Active Idle |
|
0 |
0 |
JVM 'localhost.localdomain.006' Scores:
| Target Load |
Actual Load |
ssj_ops |
| Target |
Actual |
| Calibration 1 |
|
|
107,161 |
| Calibration 2 |
|
|
105,833 |
| Calibration 3 |
|
|
104,806 |
| ssj_ops@calibrated=105,319 |
| 100% |
99.2% |
105,319 |
104,505 |
| 90% |
90.5% |
94,787 |
95,358 |
| 80% |
79.8% |
84,256 |
84,033 |
| 70% |
70.2% |
73,724 |
73,945 |
| 60% |
59.8% |
63,192 |
62,976 |
| 50% |
50.3% |
52,660 |
52,984 |
| 40% |
40.0% |
42,128 |
42,114 |
| 30% |
29.8% |
31,596 |
31,375 |
| 20% |
20.5% |
21,064 |
21,604 |
| 10% |
9.9% |
10,532 |
10,396 |
| Active Idle |
|
0 |
0 |
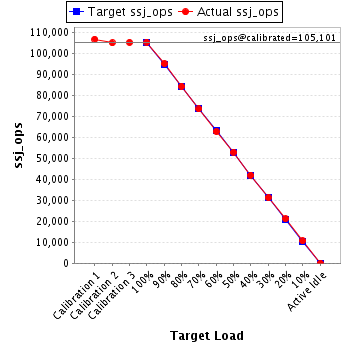
JVM 'localhost.localdomain.007' Scores:
| Target Load |
Actual Load |
ssj_ops |
| Target |
Actual |
| Calibration 1 |
|
|
106,755 |
| Calibration 2 |
|
|
104,949 |
| Calibration 3 |
|
|
105,253 |
| ssj_ops@calibrated=105,101 |
| 100% |
100.2% |
105,101 |
105,356 |
| 90% |
90.5% |
94,591 |
95,115 |
| 80% |
80.2% |
84,081 |
84,242 |
| 70% |
69.9% |
73,571 |
73,512 |
| 60% |
59.6% |
63,061 |
62,689 |
| 50% |
50.4% |
52,551 |
52,983 |
| 40% |
39.9% |
42,040 |
41,971 |
| 30% |
29.7% |
31,530 |
31,222 |
| 20% |
20.1% |
21,020 |
21,142 |
| 10% |
10.1% |
10,510 |
10,629 |
| Active Idle |
|
0 |
0 |
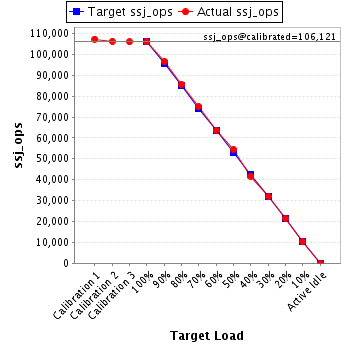
JVM 'localhost.localdomain.008' Scores:
| Target Load |
Actual Load |
ssj_ops |
| Target |
Actual |
| Calibration 1 |
|
|
107,263 |
| Calibration 2 |
|
|
106,272 |
| Calibration 3 |
|
|
105,971 |
| ssj_ops@calibrated=106,121 |
| 100% |
99.8% |
106,121 |
105,935 |
| 90% |
91.1% |
95,509 |
96,649 |
| 80% |
80.7% |
84,897 |
85,633 |
| 70% |
70.7% |
74,285 |
74,986 |
| 60% |
60.0% |
63,673 |
63,665 |
| 50% |
51.3% |
53,061 |
54,450 |
| 40% |
39.3% |
42,448 |
41,728 |
| 30% |
30.2% |
31,836 |
32,025 |
| 20% |
20.0% |
21,224 |
21,246 |
| 10% |
9.8% |
10,612 |
10,371 |
| Active Idle |
|
0 |
0 |
JVM 'localhost.localdomain.009' Scores:
| Target Load |
Actual Load |
ssj_ops |
| Target |
Actual |
| Calibration 1 |
|
|
107,554 |
| Calibration 2 |
|
|
104,830 |
| Calibration 3 |
|
|
106,070 |
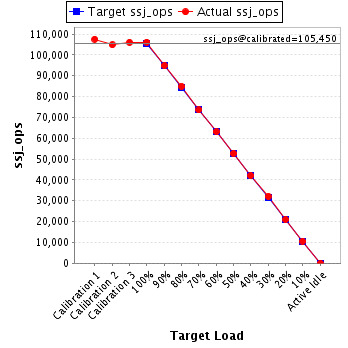
| ssj_ops@calibrated=105,450 |
| 100% |
100.6% |
105,450 |
106,118 |
| 90% |
90.0% |
94,905 |
94,872 |
| 80% |
80.5% |
84,360 |
84,933 |
| 70% |
69.8% |
73,815 |
73,567 |
| 60% |
59.8% |
63,270 |
63,098 |
| 50% |
49.9% |
52,725 |
52,621 |
| 40% |
39.8% |
42,180 |
42,001 |
| 30% |
30.4% |
31,635 |
32,108 |
| 20% |
19.9% |
21,090 |
20,979 |
| 10% |
10.1% |
10,545 |
10,621 |
| Active Idle |
|
0 |
0 |
JVM 'localhost.localdomain.010' Scores:
| Target Load |
Actual Load |
ssj_ops |
| Target |
Actual |
| Calibration 1 |
|
|
107,499 |
| Calibration 2 |
|
|
105,703 |
| Calibration 3 |
|
|
106,057 |
| ssj_ops@calibrated=105,880 |
| 100% |
99.8% |
105,880 |
105,666 |
| 90% |
89.9% |
95,292 |
95,175 |
| 80% |
80.6% |
84,704 |
85,313 |
| 70% |
70.0% |
74,116 |
74,145 |
| 60% |
59.9% |
63,528 |
63,417 |
| 50% |
49.7% |
52,940 |
52,592 |
| 40% |
40.3% |
42,352 |
42,619 |
| 30% |
29.5% |
31,764 |
31,279 |
| 20% |
19.5% |
21,176 |
20,667 |
| 10% |
10.3% |
10,588 |
10,875 |
| Active Idle |
|
0 |
0 |
JVM 'localhost.localdomain.011' Scores:
| Target Load |
Actual Load |
ssj_ops |
| Target |
Actual |
| Calibration 1 |
|
|
105,530 |
| Calibration 2 |
|
|
104,202 |
| Calibration 3 |
|
|
103,879 |
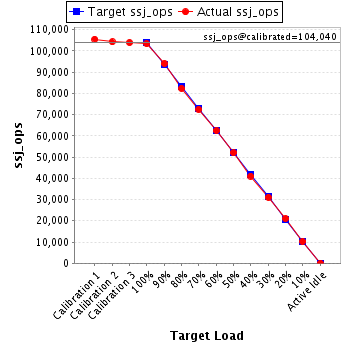
| ssj_ops@calibrated=104,040 |
| 100% |
99.4% |
104,040 |
103,366 |
| 90% |
90.4% |
93,636 |
94,086 |
| 80% |
79.1% |
83,232 |
82,344 |
| 70% |
69.7% |
72,828 |
72,471 |
| 60% |
60.0% |
62,424 |
62,441 |
| 50% |
50.0% |
52,020 |
52,004 |
| 40% |
39.4% |
41,616 |
41,021 |
| 30% |
29.8% |
31,212 |
31,005 |
| 20% |
20.2% |
20,808 |
21,054 |
| 10% |
9.9% |
10,404 |
10,258 |
| Active Idle |
|
0 |
0 |
JVM 'localhost.localdomain.012' Scores:
| Target Load |
Actual Load |
ssj_ops |
| Target |
Actual |
| Calibration 1 |
|
|
104,441 |
| Calibration 2 |
|
|
102,872 |
| Calibration 3 |
|
|
103,417 |
| ssj_ops@calibrated=103,144 |
| 100% |
100.8% |
103,144 |
104,004 |
| 90% |
89.7% |
92,830 |
92,525 |
| 80% |
79.3% |
82,516 |
81,763 |
| 70% |
69.7% |
72,201 |
71,854 |
| 60% |
60.4% |
61,887 |
62,258 |
| 50% |
50.0% |
51,572 |
51,599 |
| 40% |
40.5% |
41,258 |
41,810 |
| 30% |
30.1% |
30,943 |
31,025 |
| 20% |
20.0% |
20,629 |
20,587 |
| 10% |
9.8% |
10,314 |
10,158 |
| Active Idle |
|
0 |
0 |
JVM 'localhost.localdomain.013' Scores:
| Target Load |
Actual Load |
ssj_ops |
| Target |
Actual |
| Calibration 1 |
|
|
106,742 |
| Calibration 2 |
|
|
105,273 |
| Calibration 3 |
|
|
104,981 |
| ssj_ops@calibrated=105,127 |
| 100% |
99.4% |
105,127 |
104,499 |
| 90% |
90.4% |
94,614 |
94,996 |
| 80% |
81.0% |
84,102 |
85,166 |
| 70% |
69.2% |
73,589 |
72,736 |
| 60% |
59.9% |
63,076 |
62,926 |
| 50% |
50.3% |
52,564 |
52,904 |
| 40% |
39.7% |
42,051 |
41,692 |
| 30% |
29.9% |
31,538 |
31,467 |
| 20% |
20.3% |
21,025 |
21,350 |
| 10% |
9.7% |
10,513 |
10,183 |
| Active Idle |
|
0 |
0 |
JVM 'localhost.localdomain.014' Scores:
| Target Load |
Actual Load |
ssj_ops |
| Target |
Actual |
| Calibration 1 |
|
|
105,365 |
| Calibration 2 |
|
|
103,967 |
| Calibration 3 |
|
|
104,245 |
| ssj_ops@calibrated=104,106 |
| 100% |
99.7% |
104,106 |
103,816 |
| 90% |
90.8% |
93,696 |
94,564 |
| 80% |
80.7% |
83,285 |
84,057 |
| 70% |
71.1% |
72,874 |
74,048 |
| 60% |
59.9% |
62,464 |
62,308 |
| 50% |
50.2% |
52,053 |
52,225 |
| 40% |
40.1% |
41,643 |
41,783 |
| 30% |
30.1% |
31,232 |
31,292 |
| 20% |
20.5% |
20,821 |
21,368 |
| 10% |
10.5% |
10,411 |
10,966 |
| Active Idle |
|
0 |
0 |
JVM 'localhost.localdomain.015' Scores:
| Target Load |
Actual Load |
ssj_ops |
| Target |
Actual |
| Calibration 1 |
|
|
107,704 |
| Calibration 2 |
|
|
104,476 |
| Calibration 3 |
|
|
105,607 |
| ssj_ops@calibrated=105,041 |
| 100% |
99.3% |
105,041 |
104,323 |
| 90% |
89.4% |
94,537 |
93,876 |
| 80% |
80.3% |
84,033 |
84,325 |
| 70% |
70.0% |
73,529 |
73,576 |
| 60% |
61.1% |
63,025 |
64,148 |
| 50% |
50.3% |
52,521 |
52,784 |
| 40% |
40.4% |
42,017 |
42,410 |
| 30% |
30.1% |
31,512 |
31,589 |
| 20% |
20.0% |
21,008 |
20,987 |
| 10% |
10.5% |
10,504 |
11,075 |
| Active Idle |
|
0 |
0 |
JVM 'localhost.localdomain.016' Scores:
| Target Load |
Actual Load |
ssj_ops |
| Target |
Actual |
| Calibration 1 |
|
|
108,074 |
| Calibration 2 |
|
|
105,082 |
| Calibration 3 |
|
|
106,191 |
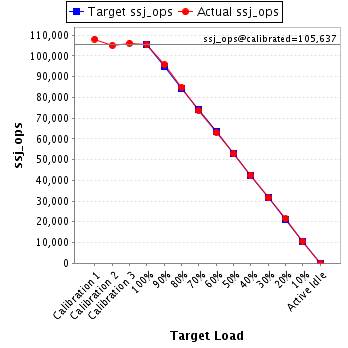
| ssj_ops@calibrated=105,637 |
| 100% |
99.8% |
105,637 |
105,408 |
| 90% |
90.7% |
95,073 |
95,781 |
| 80% |
80.2% |
84,509 |
84,747 |
| 70% |
69.8% |
73,946 |
73,754 |
| 60% |
59.7% |
63,382 |
63,075 |
| 50% |
50.0% |
52,818 |
52,787 |
| 40% |
40.3% |
42,255 |
42,525 |
| 30% |
29.9% |
31,691 |
31,537 |
| 20% |
20.2% |
21,127 |
21,381 |
| 10% |
10.1% |
10,564 |
10,654 |
| Active Idle |
|
0 |
0 |
JVM 'localhost.localdomain.017' Scores:
| Target Load |
Actual Load |
ssj_ops |
| Target |
Actual |
| Calibration 1 |
|
|
105,187 |
| Calibration 2 |
|
|
104,201 |
| Calibration 3 |
|
|
103,412 |
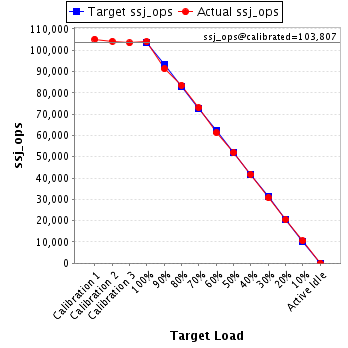
| ssj_ops@calibrated=103,807 |
| 100% |
100.3% |
103,807 |
104,115 |
| 90% |
88.0% |
93,426 |
91,321 |
| 80% |
80.5% |
83,046 |
83,576 |
| 70% |
70.3% |
72,665 |
73,017 |
| 60% |
59.0% |
62,284 |
61,278 |
| 50% |
50.0% |
51,903 |
51,939 |
| 40% |
40.1% |
41,523 |
41,592 |
| 30% |
29.6% |
31,142 |
30,736 |
| 20% |
19.7% |
20,761 |
20,461 |
| 10% |
10.1% |
10,381 |
10,487 |
| Active Idle |
|
0 |
0 |
JVM 'localhost.localdomain.018' Scores:
| Target Load |
Actual Load |
ssj_ops |
| Target |
Actual |
| Calibration 1 |
|
|
106,104 |
| Calibration 2 |
|
|
104,029 |
| Calibration 3 |
|
|
104,069 |
| ssj_ops@calibrated=104,049 |
| 100% |
100.5% |
104,049 |
104,570 |
| 90% |
89.7% |
93,644 |
93,327 |
| 80% |
80.2% |
83,239 |
83,437 |
| 70% |
70.8% |
72,834 |
73,661 |
| 60% |
59.0% |
62,429 |
61,429 |
| 50% |
50.0% |
52,025 |
52,067 |
| 40% |
40.5% |
41,620 |
42,156 |
| 30% |
29.8% |
31,215 |
30,977 |
| 20% |
20.3% |
20,810 |
21,100 |
| 10% |
10.2% |
10,405 |
10,571 |
| Active Idle |
|
0 |
0 |
JVM 'localhost.localdomain.019' Scores:
| Target Load |
Actual Load |
ssj_ops |
| Target |
Actual |
| Calibration 1 |
|
|
105,319 |
| Calibration 2 |
|
|
103,765 |
| Calibration 3 |
|
|
104,483 |
| ssj_ops@calibrated=104,124 |
| 100% |
99.7% |
104,124 |
103,805 |
| 90% |
90.3% |
93,711 |
94,040 |
| 80% |
79.8% |
83,299 |
83,050 |
| 70% |
69.6% |
72,887 |
72,444 |
| 60% |
59.7% |
62,474 |
62,134 |
| 50% |
50.4% |
52,062 |
52,442 |
| 40% |
39.7% |
41,649 |
41,354 |
| 30% |
29.7% |
31,237 |
30,913 |
| 20% |
20.0% |
20,825 |
20,846 |
| 10% |
10.0% |
10,412 |
10,387 |
| Active Idle |
|
0 |
0 |
JVM 'localhost.localdomain.020' Scores:
| Target Load |
Actual Load |
ssj_ops |
| Target |
Actual |
| Calibration 1 |
|
|
106,759 |
| Calibration 2 |
|
|
104,989 |
| Calibration 3 |
|
|
104,837 |
| ssj_ops@calibrated=104,913 |
| 100% |
99.6% |
104,913 |
104,492 |
| 90% |
90.1% |
94,422 |
94,554 |
| 80% |
79.8% |
83,930 |
83,755 |
| 70% |
69.4% |
73,439 |
72,861 |
| 60% |
60.0% |
62,948 |
62,987 |
| 50% |
50.1% |
52,457 |
52,517 |
| 40% |
40.7% |
41,965 |
42,679 |
| 30% |
30.0% |
31,474 |
31,512 |
| 20% |
19.8% |
20,983 |
20,808 |
| 10% |
9.9% |
10,491 |
10,425 |
| Active Idle |
|
0 |
0 |
JVM 'localhost.localdomain.021' Scores:
| Target Load |
Actual Load |
ssj_ops |
| Target |
Actual |
| Calibration 1 |
|
|
106,473 |
| Calibration 2 |
|
|
104,186 |
| Calibration 3 |
|
|
105,033 |
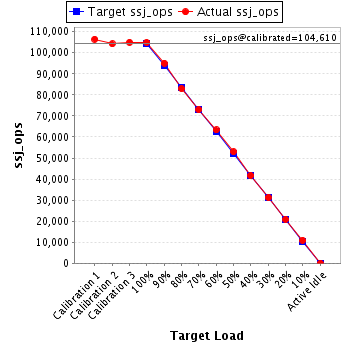
| ssj_ops@calibrated=104,610 |
| 100% |
100.2% |
104,610 |
104,815 |
| 90% |
90.9% |
94,149 |
95,064 |
| 80% |
79.2% |
83,688 |
82,895 |
| 70% |
69.8% |
73,227 |
73,021 |
| 60% |
60.5% |
62,766 |
63,317 |
| 50% |
50.6% |
52,305 |
52,946 |
| 40% |
39.8% |
41,844 |
41,646 |
| 30% |
29.8% |
31,383 |
31,216 |
| 20% |
20.0% |
20,922 |
20,903 |
| 10% |
10.5% |
10,461 |
10,942 |
| Active Idle |
|
0 |
0 |
JVM 'localhost.localdomain.022' Scores:
| Target Load |
Actual Load |
ssj_ops |
| Target |
Actual |
| Calibration 1 |
|
|
106,995 |
| Calibration 2 |
|
|
104,870 |
| Calibration 3 |
|
|
104,773 |
| ssj_ops@calibrated=104,821 |
| 100% |
99.3% |
104,821 |
104,108 |
| 90% |
90.1% |
94,339 |
94,394 |
| 80% |
81.0% |
83,857 |
84,915 |
| 70% |
69.8% |
73,375 |
73,185 |
| 60% |
59.6% |
62,893 |
62,473 |
| 50% |
49.9% |
52,411 |
52,309 |
| 40% |
39.8% |
41,928 |
41,707 |
| 30% |
30.7% |
31,446 |
32,227 |
| 20% |
20.4% |
20,964 |
21,421 |
| 10% |
9.8% |
10,482 |
10,283 |
| Active Idle |
|
0 |
0 |
JVM 'localhost.localdomain.023' Scores:
| Target Load |
Actual Load |
ssj_ops |
| Target |
Actual |
| Calibration 1 |
|
|
107,955 |
| Calibration 2 |
|
|
106,218 |
| Calibration 3 |
|
|
106,244 |
| ssj_ops@calibrated=106,231 |
| 100% |
100.0% |
106,231 |
106,181 |
| 90% |
89.4% |
95,608 |
94,996 |
| 80% |
79.8% |
84,985 |
84,726 |
| 70% |
69.7% |
74,362 |
74,071 |
| 60% |
59.5% |
63,739 |
63,176 |
| 50% |
49.8% |
53,116 |
52,900 |
| 40% |
40.8% |
42,492 |
43,311 |
| 30% |
29.7% |
31,869 |
31,533 |
| 20% |
20.1% |
21,246 |
21,350 |
| 10% |
9.8% |
10,623 |
10,365 |
| Active Idle |
|
0 |
0 |
JVM 'localhost.localdomain.024' Scores:
| Target Load |
Actual Load |
ssj_ops |
| Target |
Actual |
| Calibration 1 |
|
|
106,898 |
| Calibration 2 |
|
|
105,584 |
| Calibration 3 |
|
|
105,855 |
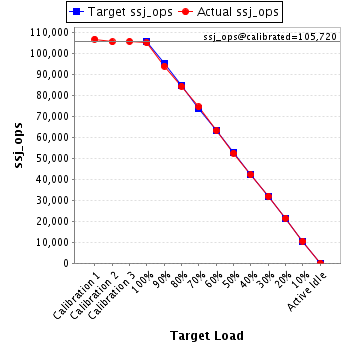
| ssj_ops@calibrated=105,720 |
| 100% |
99.4% |
105,720 |
105,124 |
| 90% |
89.0% |
95,148 |
94,048 |
| 80% |
79.8% |
84,576 |
84,391 |
| 70% |
70.5% |
74,004 |
74,562 |
| 60% |
59.8% |
63,432 |
63,271 |
| 50% |
49.7% |
52,860 |
52,551 |
| 40% |
39.9% |
42,288 |
42,153 |
| 30% |
30.2% |
31,716 |
31,964 |
| 20% |
20.3% |
21,144 |
21,503 |
| 10% |
10.0% |
10,572 |
10,546 |
| Active Idle |
|
0 |
0 |
JVM 'localhost.localdomain.025' Scores:
| Target Load |
Actual Load |
ssj_ops |
| Target |
Actual |
| Calibration 1 |
|
|
107,241 |
| Calibration 2 |
|
|
105,781 |
| Calibration 3 |
|
|
106,330 |
| ssj_ops@calibrated=106,055 |
| 100% |
100.7% |
106,055 |
106,842 |
| 90% |
90.2% |
95,450 |
95,648 |
| 80% |
79.7% |
84,844 |
84,564 |
| 70% |
70.8% |
74,239 |
75,096 |
| 60% |
60.2% |
63,633 |
63,859 |
| 50% |
50.0% |
53,028 |
53,046 |
| 40% |
40.1% |
42,422 |
42,522 |
| 30% |
29.7% |
31,817 |
31,450 |
| 20% |
19.9% |
21,211 |
21,058 |
| 10% |
9.9% |
10,606 |
10,517 |
| Active Idle |
|
0 |
0 |
JVM 'localhost.localdomain.026' Scores:
| Target Load |
Actual Load |
ssj_ops |
| Target |
Actual |
| Calibration 1 |
|
|
106,090 |
| Calibration 2 |
|
|
105,002 |
| Calibration 3 |
|
|
105,157 |
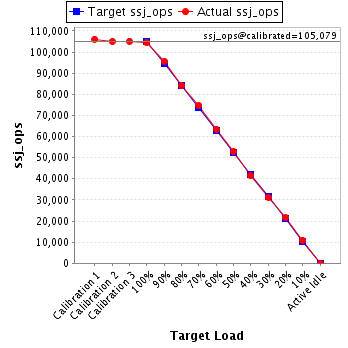
| ssj_ops@calibrated=105,079 |
| 100% |
99.4% |
105,079 |
104,451 |
| 90% |
91.0% |
94,572 |
95,655 |
| 80% |
80.1% |
84,064 |
84,137 |
| 70% |
71.1% |
73,556 |
74,673 |
| 60% |
60.3% |
63,048 |
63,355 |
| 50% |
50.2% |
52,540 |
52,786 |
| 40% |
39.4% |
42,032 |
41,358 |
| 30% |
29.8% |
31,524 |
31,305 |
| 20% |
20.4% |
21,016 |
21,475 |
| 10% |
10.3% |
10,508 |
10,858 |
| Active Idle |
|
0 |
0 |
JVM 'localhost.localdomain.027' Scores:
| Target Load |
Actual Load |
ssj_ops |
| Target |
Actual |
| Calibration 1 |
|
|
106,117 |
| Calibration 2 |
|
|
104,019 |
| Calibration 3 |
|
|
104,183 |
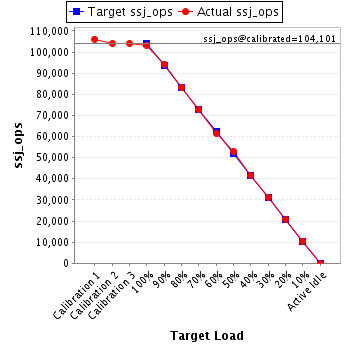
| ssj_ops@calibrated=104,101 |
| 100% |
99.3% |
104,101 |
103,353 |
| 90% |
90.6% |
93,691 |
94,322 |
| 80% |
80.1% |
83,281 |
83,366 |
| 70% |
69.8% |
72,871 |
72,637 |
| 60% |
59.1% |
62,461 |
61,479 |
| 50% |
50.7% |
52,051 |
52,829 |
| 40% |
40.0% |
41,641 |
41,635 |
| 30% |
30.1% |
31,230 |
31,329 |
| 20% |
20.0% |
20,820 |
20,800 |
| 10% |
10.1% |
10,410 |
10,496 |
| Active Idle |
|
0 |
0 |
JVM 'localhost.localdomain.028' Scores:
| Target Load |
Actual Load |
ssj_ops |
| Target |
Actual |
| Calibration 1 |
|
|
106,946 |
| Calibration 2 |
|
|
104,210 |
| Calibration 3 |
|
|
104,327 |
| ssj_ops@calibrated=104,269 |
| 100% |
100.2% |
104,269 |
104,491 |
| 90% |
90.1% |
93,842 |
93,918 |
| 80% |
79.5% |
83,415 |
82,847 |
| 70% |
70.2% |
72,988 |
73,207 |
| 60% |
60.5% |
62,561 |
63,044 |
| 50% |
50.5% |
52,134 |
52,660 |
| 40% |
39.9% |
41,708 |
41,613 |
| 30% |
29.8% |
31,281 |
31,055 |
| 20% |
20.3% |
20,854 |
21,192 |
| 10% |
10.1% |
10,427 |
10,554 |
| Active Idle |
|
0 |
0 |
JVM 'localhost.localdomain.029' Scores:
| Target Load |
Actual Load |
ssj_ops |
| Target |
Actual |
| Calibration 1 |
|
|
107,049 |
| Calibration 2 |
|
|
106,560 |
| Calibration 3 |
|
|
105,269 |
| ssj_ops@calibrated=105,914 |
| 100% |
99.7% |
105,914 |
105,622 |
| 90% |
90.3% |
95,323 |
95,629 |
| 80% |
79.3% |
84,731 |
84,029 |
| 70% |
70.6% |
74,140 |
74,754 |
| 60% |
59.2% |
63,549 |
62,737 |
| 50% |
50.1% |
52,957 |
53,020 |
| 40% |
39.7% |
42,366 |
42,020 |
| 30% |
30.6% |
31,774 |
32,360 |
| 20% |
19.8% |
21,183 |
21,023 |
| 10% |
10.0% |
10,591 |
10,612 |
| Active Idle |
|
0 |
0 |
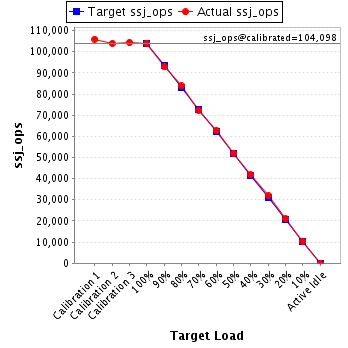
JVM 'localhost.localdomain.030' Scores:
| Target Load |
Actual Load |
ssj_ops |
| Target |
Actual |
| Calibration 1 |
|
|
105,936 |
| Calibration 2 |
|
|
103,899 |
| Calibration 3 |
|
|
104,298 |
| ssj_ops@calibrated=104,098 |
| 100% |
99.9% |
104,098 |
104,007 |
| 90% |
89.2% |
93,689 |
92,836 |
| 80% |
80.5% |
83,279 |
83,822 |
| 70% |
69.6% |
72,869 |
72,441 |
| 60% |
60.3% |
62,459 |
62,796 |
| 50% |
50.0% |
52,049 |
52,100 |
| 40% |
40.2% |
41,639 |
41,836 |
| 30% |
30.7% |
31,230 |
31,910 |
| 20% |
20.1% |
20,820 |
20,927 |
| 10% |
10.1% |
10,410 |
10,521 |
| Active Idle |
|
0 |
0 |
JVM 'localhost.localdomain.031' Scores:
| Target Load |
Actual Load |
ssj_ops |
| Target |
Actual |
| Calibration 1 |
|
|
105,396 |
| Calibration 2 |
|
|
104,819 |
| Calibration 3 |
|
|
105,800 |
| ssj_ops@calibrated=105,309 |
| 100% |
99.8% |
105,309 |
105,053 |
| 90% |
89.6% |
94,778 |
94,390 |
| 80% |
79.1% |
84,247 |
83,291 |
| 70% |
69.9% |
73,716 |
73,612 |
| 60% |
60.2% |
63,186 |
63,362 |
| 50% |
49.1% |
52,655 |
51,749 |
| 40% |
40.2% |
42,124 |
42,331 |
| 30% |
29.5% |
31,593 |
31,029 |
| 20% |
20.4% |
21,062 |
21,462 |
| 10% |
9.9% |
10,531 |
10,396 |
| Active Idle |
|
0 |
0 |
JVM 'localhost.localdomain.032' Scores:
| Target Load |
Actual Load |
ssj_ops |
| Target |
Actual |
| Calibration 1 |
|
|
106,326 |
| Calibration 2 |
|
|
104,758 |
| Calibration 3 |
|
|
104,891 |
| ssj_ops@calibrated=104,825 |
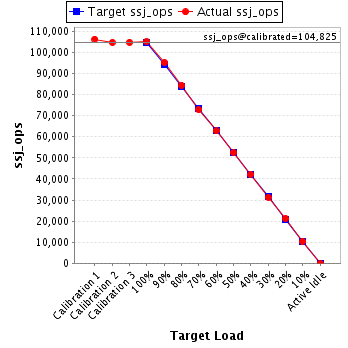
| 100% |
100.2% |
104,825 |
105,081 |
| 90% |
90.9% |
94,342 |
95,241 |
| 80% |
80.6% |
83,860 |
84,471 |
| 70% |
69.6% |
73,377 |
72,913 |
| 60% |
59.9% |
62,895 |
62,779 |
| 50% |
50.0% |
52,412 |
52,412 |
| 40% |
40.3% |
41,930 |
42,262 |
| 30% |
29.9% |
31,447 |
31,321 |
| 20% |
20.2% |
20,965 |
21,184 |
| 10% |
9.9% |
10,482 |
10,412 |
| Active Idle |
|
0 |
0 |
JVM 'localhost.localdomain.033' Scores:
| Target Load |
Actual Load |
ssj_ops |
| Target |
Actual |
| Calibration 1 |
|
|
106,333 |
| Calibration 2 |
|
|
104,321 |
| Calibration 3 |
|
|
104,895 |
| ssj_ops@calibrated=104,608 |
| 100% |
99.9% |
104,608 |
104,470 |
| 90% |
88.7% |
94,147 |
92,772 |
| 80% |
79.7% |
83,686 |
83,365 |
| 70% |
69.8% |
73,225 |
73,003 |
| 60% |
61.0% |
62,765 |
63,802 |
| 50% |
50.8% |
52,304 |
53,167 |
| 40% |
40.2% |
41,843 |
42,043 |
| 30% |
30.4% |
31,382 |
31,753 |
| 20% |
20.0% |
20,922 |
20,934 |
| 10% |
10.2% |
10,461 |
10,721 |
| Active Idle |
|
0 |
0 |
JVM 'localhost.localdomain.034' Scores:
| Target Load |
Actual Load |
ssj_ops |
| Target |
Actual |
| Calibration 1 |
|
|
106,336 |
| Calibration 2 |
|
|
107,060 |
| Calibration 3 |
|
|
106,877 |
| ssj_ops@calibrated=106,968 |
| 100% |
99.2% |
106,968 |
106,066 |
| 90% |
89.6% |
96,271 |
95,865 |
| 80% |
80.0% |
85,575 |
85,534 |
| 70% |
70.4% |
74,878 |
75,308 |
| 60% |
59.3% |
64,181 |
63,458 |
| 50% |
50.1% |
53,484 |
53,612 |
| 40% |
40.0% |
42,787 |
42,798 |
| 30% |
29.7% |
32,090 |
31,800 |
| 20% |
20.0% |
21,394 |
21,418 |
| 10% |
10.0% |
10,697 |
10,654 |
| Active Idle |
|
0 |
0 |
JVM 'localhost.localdomain.035' Scores:
| Target Load |
Actual Load |
ssj_ops |
| Target |
Actual |
| Calibration 1 |
|
|
105,862 |
| Calibration 2 |
|
|
104,299 |
| Calibration 3 |
|
|
105,034 |
| ssj_ops@calibrated=104,666 |
| 100% |
100.6% |
104,666 |
105,279 |
| 90% |
90.2% |
94,200 |
94,375 |
| 80% |
79.6% |
83,733 |
83,342 |
| 70% |
70.2% |
73,267 |
73,458 |
| 60% |
60.4% |
62,800 |
63,218 |
| 50% |
49.7% |
52,333 |
52,071 |
| 40% |
40.3% |
41,867 |
42,130 |
| 30% |
30.1% |
31,400 |
31,527 |
| 20% |
19.8% |
20,933 |
20,745 |
| 10% |
10.0% |
10,467 |
10,465 |
| Active Idle |
|
0 |
0 |
JVM 'localhost.localdomain.036' Scores:
| Target Load |
Actual Load |
ssj_ops |
| Target |
Actual |
| Calibration 1 |
|
|
106,323 |
| Calibration 2 |
|
|
105,520 |
| Calibration 3 |
|
|
105,166 |
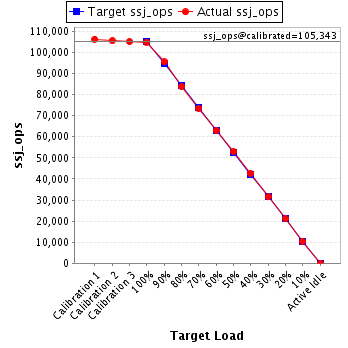
| ssj_ops@calibrated=105,343 |
| 100% |
99.6% |
105,343 |
104,941 |
| 90% |
90.7% |
94,809 |
95,504 |
| 80% |
79.6% |
84,275 |
83,805 |
| 70% |
69.9% |
73,740 |
73,585 |
| 60% |
59.8% |
63,206 |
63,017 |
| 50% |
50.2% |
52,672 |
52,888 |
| 40% |
40.4% |
42,137 |
42,592 |
| 30% |
29.9% |
31,603 |
31,462 |
| 20% |
20.0% |
21,069 |
21,029 |
| 10% |
9.9% |
10,534 |
10,450 |
| Active Idle |
|
0 |
0 |
JVM 'localhost.localdomain.037' Scores:
| Target Load |
Actual Load |
ssj_ops |
| Target |
Actual |
| Calibration 1 |
|
|
105,685 |
| Calibration 2 |
|
|
104,433 |
| Calibration 3 |
|
|
104,589 |
| ssj_ops@calibrated=104,511 |
| 100% |
100.5% |
104,511 |
105,082 |
| 90% |
90.3% |
94,060 |
94,378 |
| 80% |
80.4% |
83,609 |
84,007 |
| 70% |
69.9% |
73,158 |
73,010 |
| 60% |
60.5% |
62,706 |
63,233 |
| 50% |
50.3% |
52,255 |
52,525 |
| 40% |
40.4% |
41,804 |
42,243 |
| 30% |
29.6% |
31,353 |
30,896 |
| 20% |
19.9% |
20,902 |
20,796 |
| 10% |
9.9% |
10,451 |
10,376 |
| Active Idle |
|
0 |
0 |
JVM 'localhost.localdomain.038' Scores:
| Target Load |
Actual Load |
ssj_ops |
| Target |
Actual |
| Calibration 1 |
|
|
106,504 |
| Calibration 2 |
|
|
104,409 |
| Calibration 3 |
|
|
104,481 |
| ssj_ops@calibrated=104,445 |
| 100% |
99.4% |
104,445 |
103,806 |
| 90% |
89.7% |
94,000 |
93,649 |
| 80% |
80.0% |
83,556 |
83,535 |
| 70% |
70.2% |
73,111 |
73,273 |
| 60% |
59.4% |
62,667 |
62,015 |
| 50% |
50.4% |
52,222 |
52,640 |
| 40% |
39.7% |
41,778 |
41,422 |
| 30% |
30.4% |
31,333 |
31,767 |
| 20% |
19.5% |
20,889 |
20,383 |
| 10% |
9.9% |
10,444 |
10,348 |
| Active Idle |
|
0 |
0 |
JVM 'localhost.localdomain.039' Scores:
| Target Load |
Actual Load |
ssj_ops |
| Target |
Actual |
| Calibration 1 |
|
|
104,336 |
| Calibration 2 |
|
|
104,368 |
| Calibration 3 |
|
|
104,244 |
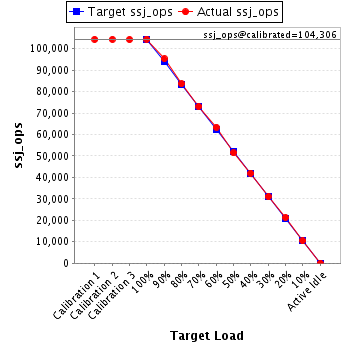
| ssj_ops@calibrated=104,306 |
| 100% |
100.1% |
104,306 |
104,460 |
| 90% |
91.4% |
93,876 |
95,321 |
| 80% |
80.1% |
83,445 |
83,599 |
| 70% |
70.1% |
73,014 |
73,076 |
| 60% |
60.8% |
62,584 |
63,400 |
| 50% |
49.3% |
52,153 |
51,462 |
| 40% |
40.3% |
41,722 |
41,991 |
| 30% |
29.8% |
31,292 |
31,050 |
| 20% |
20.4% |
20,861 |
21,308 |
| 10% |
10.1% |
10,431 |
10,492 |
| Active Idle |
|
0 |
0 |
JVM 'localhost.localdomain.040' Scores:
| Target Load |
Actual Load |
ssj_ops |
| Target |
Actual |
| Calibration 1 |
|
|
105,233 |
| Calibration 2 |
|
|
103,829 |
| Calibration 3 |
|
|
104,347 |
| ssj_ops@calibrated=104,088 |
| 100% |
98.9% |
104,088 |
102,938 |
| 90% |
90.4% |
93,680 |
94,121 |
| 80% |
80.0% |
83,271 |
83,312 |
| 70% |
70.2% |
72,862 |
73,106 |
| 60% |
59.4% |
62,453 |
61,789 |
| 50% |
49.1% |
52,044 |
51,152 |
| 40% |
40.0% |
41,635 |
41,662 |
| 30% |
29.7% |
31,227 |
30,958 |
| 20% |
19.8% |
20,818 |
20,632 |
| 10% |
10.2% |
10,409 |
10,579 |
| Active Idle |
|
0 |
0 |
JVM 'localhost.localdomain.041' Scores:
| Target Load |
Actual Load |
ssj_ops |
| Target |
Actual |
| Calibration 1 |
|
|
106,121 |
| Calibration 2 |
|
|
105,635 |
| Calibration 3 |
|
|
105,225 |
| ssj_ops@calibrated=105,430 |
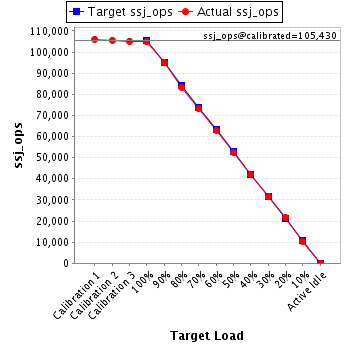
| 100% |
99.6% |
105,430 |
105,042 |
| 90% |
90.0% |
94,887 |
94,920 |
| 80% |
79.0% |
84,344 |
83,318 |
| 70% |
69.3% |
73,801 |
73,101 |
| 60% |
59.6% |
63,258 |
62,881 |
| 50% |
49.8% |
52,715 |
52,545 |
| 40% |
39.8% |
42,172 |
41,969 |
| 30% |
29.8% |
31,629 |
31,458 |
| 20% |
20.5% |
21,086 |
21,637 |
| 10% |
10.0% |
10,543 |
10,492 |
| Active Idle |
|
0 |
0 |
JVM 'localhost.localdomain.042' Scores:
| Target Load |
Actual Load |
ssj_ops |
| Target |
Actual |
| Calibration 1 |
|
|
106,619 |
| Calibration 2 |
|
|
105,533 |
| Calibration 3 |
|
|
105,333 |
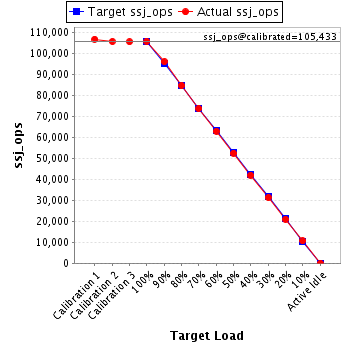
| ssj_ops@calibrated=105,433 |
| 100% |
100.1% |
105,433 |
105,589 |
| 90% |
91.0% |
94,890 |
95,897 |
| 80% |
80.1% |
84,346 |
84,502 |
| 70% |
69.8% |
73,803 |
73,635 |
| 60% |
59.6% |
63,260 |
62,808 |
| 50% |
49.7% |
52,716 |
52,409 |
| 40% |
39.7% |
42,173 |
41,879 |
| 30% |
29.6% |
31,630 |
31,219 |
| 20% |
19.9% |
21,087 |
20,942 |
| 10% |
10.1% |
10,543 |
10,617 |
| Active Idle |
|
0 |
0 |
JVM 'localhost.localdomain.043' Scores:
| Target Load |
Actual Load |
ssj_ops |
| Target |
Actual |
| Calibration 1 |
|
|
107,610 |
| Calibration 2 |
|
|
105,482 |
| Calibration 3 |
|
|
105,909 |
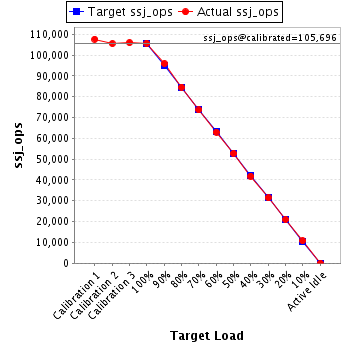
| ssj_ops@calibrated=105,696 |
| 100% |
99.9% |
105,696 |
105,572 |
| 90% |
90.7% |
95,126 |
95,890 |
| 80% |
80.0% |
84,557 |
84,606 |
| 70% |
69.6% |
73,987 |
73,613 |
| 60% |
59.6% |
63,417 |
62,999 |
| 50% |
49.9% |
52,848 |
52,696 |
| 40% |
39.6% |
42,278 |
41,842 |
| 30% |
29.7% |
31,709 |
31,414 |
| 20% |
19.9% |
21,139 |
21,008 |
| 10% |
10.2% |
10,570 |
10,758 |
| Active Idle |
|
0 |
0 |
JVM 'localhost.localdomain.044' Scores:
| Target Load |
Actual Load |
ssj_ops |
| Target |
Actual |
| Calibration 1 |
|
|
106,501 |
| Calibration 2 |
|
|
105,017 |
| Calibration 3 |
|
|
105,627 |
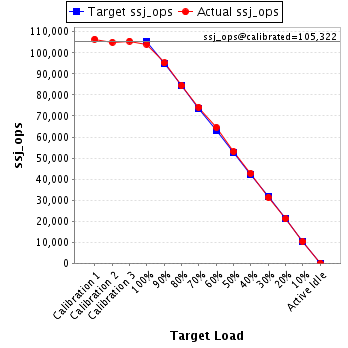
| ssj_ops@calibrated=105,322 |
| 100% |
98.8% |
105,322 |
104,068 |
| 90% |
90.4% |
94,790 |
95,181 |
| 80% |
80.2% |
84,258 |
84,425 |
| 70% |
70.4% |
73,725 |
74,141 |
| 60% |
61.3% |
63,193 |
64,604 |
| 50% |
50.4% |
52,661 |
53,050 |
| 40% |
40.5% |
42,129 |
42,698 |
| 30% |
29.7% |
31,597 |
31,304 |
| 20% |
20.0% |
21,064 |
21,085 |
| 10% |
9.8% |
10,532 |
10,350 |
| Active Idle |
|
0 |
0 |
JVM 'localhost.localdomain.045' Scores:
| Target Load |
Actual Load |
ssj_ops |
| Target |
Actual |
| Calibration 1 |
|
|
105,537 |
| Calibration 2 |
|
|
104,116 |
| Calibration 3 |
|
|
104,847 |
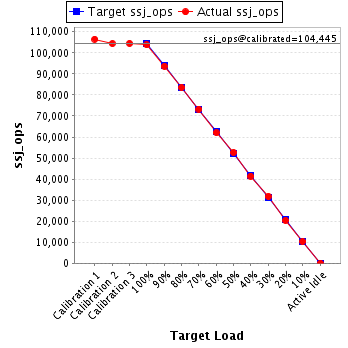
| ssj_ops@calibrated=104,482 |
| 100% |
99.8% |
104,482 |
104,306 |
| 90% |
90.1% |
94,034 |
94,141 |
| 80% |
80.3% |
83,585 |
83,926 |
| 70% |
69.9% |
73,137 |
73,054 |
| 60% |
60.1% |
62,689 |
62,804 |
| 50% |
50.4% |
52,241 |
52,651 |
| 40% |
40.1% |
41,793 |
41,946 |
| 30% |
29.6% |
31,345 |
30,905 |
| 20% |
19.9% |
20,896 |
20,764 |
| 10% |
9.7% |
10,448 |
10,112 |
| Active Idle |
|
0 |
0 |
JVM 'localhost.localdomain.046' Scores:
| Target Load |
Actual Load |
ssj_ops |
| Target |
Actual |
| Calibration 1 |
|
|
105,256 |
| Calibration 2 |
|
|
103,717 |
| Calibration 3 |
|
|
104,871 |
| ssj_ops@calibrated=104,294 |
| 100% |
100.1% |
104,294 |
104,353 |
| 90% |
89.9% |
93,864 |
93,749 |
| 80% |
79.9% |
83,435 |
83,370 |
| 70% |
69.9% |
73,006 |
72,891 |
| 60% |
60.0% |
62,576 |
62,550 |
| 50% |
50.5% |
52,147 |
52,621 |
| 40% |
40.3% |
41,718 |
41,985 |
| 30% |
28.9% |
31,288 |
30,175 |
| 20% |
20.1% |
20,859 |
20,964 |
| 10% |
10.2% |
10,429 |
10,675 |
| Active Idle |
|
0 |
0 |
JVM 'localhost.localdomain.047' Scores:
| Target Load |
Actual Load |
ssj_ops |
| Target |
Actual |
| Calibration 1 |
|
|
104,883 |
| Calibration 2 |
|
|
104,332 |
| Calibration 3 |
|
|
103,916 |
| ssj_ops@calibrated=104,124 |
| 100% |
100.0% |
104,124 |
104,094 |
| 90% |
89.9% |
93,712 |
93,609 |
| 80% |
80.5% |
83,299 |
83,806 |
| 70% |
70.1% |
72,887 |
73,003 |
| 60% |
59.4% |
62,474 |
61,894 |
| 50% |
49.8% |
52,062 |
51,837 |
| 40% |
40.7% |
41,650 |
42,333 |
| 30% |
29.6% |
31,237 |
30,867 |
| 20% |
20.0% |
20,825 |
20,792 |
| 10% |
10.2% |
10,412 |
10,617 |
| Active Idle |
|
0 |
0 |
JVM 'localhost.localdomain.048' Scores:
| Target Load |
Actual Load |
ssj_ops |
| Target |
Actual |
| Calibration 1 |
|
|
105,711 |
| Calibration 2 |
|
|
104,810 |
| Calibration 3 |
|
|
105,002 |
| ssj_ops@calibrated=104,906 |
| 100% |
99.6% |
104,906 |
104,462 |
| 90% |
89.2% |
94,415 |
93,628 |
| 80% |
79.8% |
83,924 |
83,712 |
| 70% |
69.8% |
73,434 |
73,238 |
| 60% |
60.8% |
62,943 |
63,809 |
| 50% |
50.0% |
52,453 |
52,423 |
| 40% |
39.7% |
41,962 |
41,676 |
| 30% |
29.8% |
31,472 |
31,233 |
| 20% |
19.9% |
20,981 |
20,864 |
| 10% |
10.0% |
10,491 |
10,479 |
| Active Idle |
|
0 |
0 |
JVM 'localhost.localdomain.049' Scores:
| Target Load |
Actual Load |
ssj_ops |
| Target |
Actual |
| Calibration 1 |
|
|
106,612 |
| Calibration 2 |
|
|
104,964 |
| Calibration 3 |
|
|
105,328 |
| ssj_ops@calibrated=105,146 |
| 100% |
99.2% |
105,146 |
104,257 |
| 90% |
90.1% |
94,631 |
94,715 |
| 80% |
80.5% |
84,117 |
84,681 |
| 70% |
70.1% |
73,602 |
73,683 |
| 60% |
60.0% |
63,087 |
63,139 |
| 50% |
49.6% |
52,573 |
52,179 |
| 40% |
40.2% |
42,058 |
42,275 |
| 30% |
30.7% |
31,544 |
32,308 |
| 20% |
19.9% |
21,029 |
20,953 |
| 10% |
9.6% |
10,515 |
10,108 |
| Active Idle |
|
0 |
0 |
JVM 'localhost.localdomain.050' Scores:
| Target Load |
Actual Load |
ssj_ops |
| Target |
Actual |
| Calibration 1 |
|
|
106,423 |
| Calibration 2 |
|
|
104,265 |
| Calibration 3 |
|
|
104,823 |
| ssj_ops@calibrated=104,544 |
| 100% |
99.1% |
104,544 |
103,552 |
| 90% |
90.4% |
94,090 |
94,533 |
| 80% |
80.3% |
83,635 |
83,908 |
| 70% |
70.8% |
73,181 |
74,020 |
| 60% |
59.6% |
62,726 |
62,277 |
| 50% |
50.1% |
52,272 |
52,384 |
| 40% |
40.2% |
41,818 |
42,027 |
| 30% |
29.5% |
31,363 |
30,883 |
| 20% |
19.8% |
20,909 |
20,752 |
| 10% |
10.1% |
10,454 |
10,512 |
| Active Idle |
|
0 |
0 |
JVM 'localhost.localdomain.051' Scores:
| Target Load |
Actual Load |
ssj_ops |
| Target |
Actual |
| Calibration 1 |
|
|
106,651 |
| Calibration 2 |
|
|
104,691 |
| Calibration 3 |
|
|
105,577 |
| ssj_ops@calibrated=105,134 |
| 100% |
99.9% |
105,134 |
105,027 |
| 90% |
89.9% |
94,620 |
94,520 |
| 80% |
79.9% |
84,107 |
83,999 |
| 70% |
69.9% |
73,594 |
73,441 |
| 60% |
60.5% |
63,080 |
63,655 |
| 50% |
50.7% |
52,567 |
53,312 |
| 40% |
39.6% |
42,054 |
41,632 |
| 30% |
30.4% |
31,540 |
32,000 |
| 20% |
20.1% |
21,027 |
21,175 |
| 10% |
9.9% |
10,513 |
10,367 |
| Active Idle |
|
0 |
0 |
JVM 'localhost.localdomain.052' Scores:
| Target Load |
Actual Load |
ssj_ops |
| Target |
Actual |
| Calibration 1 |
|
|
106,380 |
| Calibration 2 |
|
|
104,169 |
| Calibration 3 |
|
|
104,954 |
| ssj_ops@calibrated=104,561 |
| 100% |
99.8% |
104,561 |
104,355 |
| 90% |
89.7% |
94,105 |
93,763 |
| 80% |
80.7% |
83,649 |
84,361 |
| 70% |
69.6% |
73,193 |
72,748 |
| 60% |
59.9% |
62,737 |
62,628 |
| 50% |
49.7% |
52,281 |
51,932 |
| 40% |
40.2% |
41,824 |
42,050 |
| 30% |
30.0% |
31,368 |
31,328 |
| 20% |
19.8% |
20,912 |
20,696 |
| 10% |
10.1% |
10,456 |
10,612 |
| Active Idle |
|
0 |
0 |
JVM 'localhost.localdomain.053' Scores:
| Target Load |
Actual Load |
ssj_ops |
| Target |
Actual |
| Calibration 1 |
|
|
106,575 |
| Calibration 2 |
|
|
104,623 |
| Calibration 3 |
|
|
103,850 |
| ssj_ops@calibrated=104,237 |
| 100% |
100.7% |
104,237 |
105,002 |
| 90% |
91.2% |
93,813 |
95,068 |
| 80% |
80.1% |
83,389 |
83,541 |
| 70% |
70.3% |
72,966 |
73,290 |
| 60% |
59.1% |
62,542 |
61,656 |
| 50% |
50.5% |
52,118 |
52,683 |
| 40% |
39.7% |
41,695 |
41,359 |
| 30% |
29.8% |
31,271 |
31,102 |
| 20% |
20.2% |
20,847 |
21,012 |
| 10% |
10.1% |
10,424 |
10,533 |
| Active Idle |
|
0 |
0 |
JVM 'localhost.localdomain.054' Scores:
| Target Load |
Actual Load |
ssj_ops |
| Target |
Actual |
| Calibration 1 |
|
|
105,723 |
| Calibration 2 |
|
|
105,341 |
| Calibration 3 |
|
|
106,212 |
| ssj_ops@calibrated=105,777 |
| 100% |
99.6% |
105,777 |
105,362 |
| 90% |
90.4% |
95,199 |
95,618 |
| 80% |
80.5% |
84,622 |
85,160 |
| 70% |
69.2% |
74,044 |
73,167 |
| 60% |
60.1% |
63,466 |
63,609 |
| 50% |
49.4% |
52,888 |
52,221 |
| 40% |
40.1% |
42,311 |
42,462 |
| 30% |
30.2% |
31,733 |
31,926 |
| 20% |
20.3% |
21,155 |
21,508 |
| 10% |
10.0% |
10,578 |
10,533 |
| Active Idle |
|
0 |
0 |
JVM 'localhost.localdomain.055' Scores:
| Target Load |
Actual Load |
ssj_ops |
| Target |
Actual |
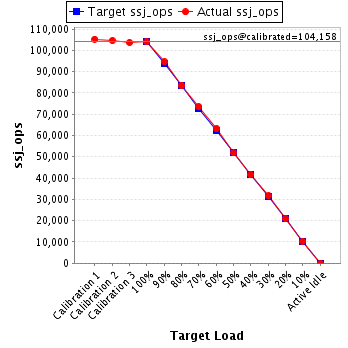
| Calibration 1 |
|
|
105,258 |
| Calibration 2 |
|
|
104,596 |
| Calibration 3 |
|
|
103,720 |
| ssj_ops@calibrated=104,158 |
| 100% |
99.8% |
104,158 |
103,965 |
| 90% |
90.8% |
93,742 |
94,597 |
| 80% |
80.1% |
83,327 |
83,461 |
| 70% |
70.6% |
72,911 |
73,564 |
| 60% |
60.7% |
62,495 |
63,234 |
| 50% |
49.7% |
52,079 |
51,793 |
| 40% |
39.9% |
41,663 |
41,581 |
| 30% |
30.4% |
31,247 |
31,640 |
| 20% |
20.0% |
20,832 |
20,825 |
| 10% |
10.0% |
10,416 |
10,392 |
| Active Idle |
|
0 |
0 |
JVM 'localhost.localdomain.056' Scores:
| Target Load |
Actual Load |
ssj_ops |
| Target |
Actual |
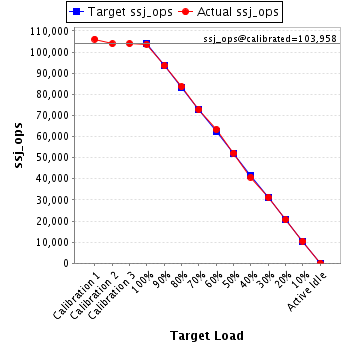
| Calibration 1 |
|
|
106,119 |
| Calibration 2 |
|
|
103,937 |
| Calibration 3 |
|
|
103,979 |
| ssj_ops@calibrated=103,958 |
| 100% |
99.7% |
103,958 |
103,695 |
| 90% |
90.0% |
93,563 |
93,582 |
| 80% |
80.5% |
83,167 |
83,654 |
| 70% |
70.0% |
72,771 |
72,794 |
| 60% |
60.9% |
62,375 |
63,355 |
| 50% |
50.2% |
51,979 |
52,193 |
| 40% |
39.2% |
41,583 |
40,787 |
| 30% |
30.1% |
31,188 |
31,243 |
| 20% |
19.8% |
20,792 |
20,608 |
| 10% |
10.1% |
10,396 |
10,504 |
| Active Idle |
|
0 |
0 |