SPECpower_ssj2008
Host 'SUT01' Performance Report
Copyright © 2007-2019 Standard Performance Evaluation Corporation
| Hewlett Packard Enterprise ProLiant DL360 Gen10 | ssj_ops@100% = 2,944,732 ssj_ops@100% per JVM = 1,472,366 |
||||
| Test Sponsor: | Hewlett Packard Enterprise | SPEC License #: | 3 | Test Method: | Single Node |
| Tested By: | Hewlett Packard Enterprise | Test Location: | Houston, TX, USA | Test Date: | Mar 12, 2019 |
| Hardware Availability: | Apr-2019 | Software Availability: | Mar-2019 | Publication: | Apr 2, 2019 |
| System Source: | Single Supplier | System Designation: | Server | Power Provisioning: | Line-powered |
| Target Load | Actual Load | ssj_ops | |
|---|---|---|---|
| Target | Actual | ||
| Calibration 1 | 2,949,527 | ||
| Calibration 2 | 2,951,167 | ||
| Calibration 3 | 2,943,559 | ||
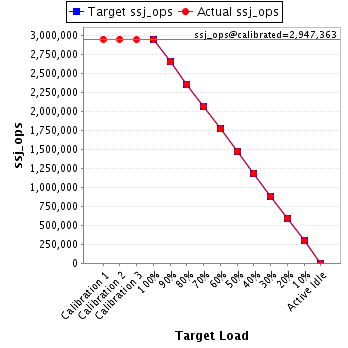
| ssj_ops@calibrated=2,947,363 | |||
| 100% | 99.9% | 2,947,363 | 2,944,732 |
| 90% | 89.9% | 2,652,627 | 2,651,137 |
| 80% | 80.1% | 2,357,891 | 2,359,942 |
| 70% | 70.0% | 2,063,154 | 2,062,405 |
| 60% | 60.0% | 1,768,418 | 1,768,964 |
| 50% | 50.0% | 1,473,682 | 1,474,922 |
| 40% | 40.0% | 1,178,945 | 1,179,864 |
| 30% | 30.0% | 884,209 | 884,222 |
| 20% | 20.0% | 589,473 | 588,997 |
| 10% | 10.0% | 294,736 | 294,973 |
| Active Idle | 0 | 0 | |
| Set Identifier: | SUT |
| Set Description: | System Under Test |
| # of Identical Nodes: | 1 |
| Comment: | SUT |
| Hardware | |
|---|---|
| Hardware Vendor: | Hewlett Packard Enterprise |
| Model: | ProLiant DL360 Gen10 |
| Form Factor: | 1U |
| CPU Name: | Intel Xeon Platinum 8280 @ 2.70GHz (Intel Turbo Boost Technology up to 4.00 GHz) |
| CPU Characteristics: | 28-Core, 2.70 GHz, 38.5MB L3 Cache |
| CPU Frequency (MHz): | 2700 |
| CPU(s) Enabled: | 28 cores, 1 chip, 28 cores/chip |
| Hardware Threads: | 56 (2 / core) |
| CPU(s) Orderable: | 1,2 chips |
| Primary Cache: | 32 KB I + 32 KB D on chip per core |
| Secondary Cache: | 1 MB I+D on chip per core |
| Tertiary Cache: | 39424 KB I+D on chip per chip |
| Other Cache: | None |
| Memory Amount (GB): | 48 |
| # and size of DIMM: | 6 x 8182 MB |
| Memory Details: | 6 x 8GB 2Rx8 PC4-2666V-R; slots 1, 3, 5, 8, 10, and 12 populated on each socket |
| Power Supply Quantity and Rating (W): | 1 x 800 |
| Power Supply Details: | HPE 800W Flex Slot Titanium Hot Plug Low Halogen Power Supply 96% (865438-B21) |
| Disk Drive: | 1 x HPE 240GB SATA M.2 2280 SSD (875488-B21) |
| Disk Controller: | Embedded SATA Controller |
| # and type of Network Interface Cards (NICs) Installed: | 1 x HPE Ethernet 1Gb 4-port 331i Adapter |
| NICs Enabled in Firmware / OS / Connected: | 4/4/1 |
| Network Speed (Mbit): | 1000 |
| Keyboard: | None |
| Mouse: | None |
| Monitor: | None |
| Optical Drives: | No |
| Other Hardware: | H/S: High Performance, 7 x Standard Cooling Fans |
| Software | |
|---|---|
| Power Management: | Enabled (see SUT Notes) |
| Operating System (OS): | Windows Server 2012 R2 Datacenter |
| OS Version: | Version 6.3 (Build 9600) |
| Filesystem: | NTFS |
| JVM Vendor: | Oracle Corporation |
| JVM Version: | Oracle Java HotSpot(TM) 64-Bit Server VM (build 24.80-b11, mixed mode), version 1.7.0_80 |
| JVM Command-line Options: | -server -Xmn19000m -Xms21000m -Xmx21000m -XX:SurvivorRatio=1 -XX:TargetSurvivorRatio=99 -XX:AllocatePrefetchDistance=256 -XX:AllocatePrefetchLines=4 -XX:LoopUnrollLimit=45 -XX:InitialTenuringThreshold=12 -XX:MaxTenuringThreshold=15 -XX:ParallelGCThreads=28 -XX:InlineSmallCode=3900 -XX:MaxInlineSize=270 -XX:FreqInlineSize=2500 -XX:+AggressiveOpts -XX:+UseLargePages -XX:+UseParallelOldGC |
| JVM Affinity: | start /NODE [0,1,2,3] /AFFINITY [0xFFFFFFF] |
| JVM Instances: | 2 |
| JVM Initial Heap (MB): | 21000 |
| JVM Maximum Heap (MB): | 21000 |
| JVM Address Bits: | 64 |
| Boot Firmware Version: | U32 v2.00 (12/17/2018) |
| Management Firmware Version: | 1.40 Feb 05 2019 |
| Workload Version: | SSJ 1.2.10 |
| Director Location: | Controller |
| Other Software: | HPE Service Pack for ProLiant (SPP) - Version 2019.03.0 (Mar 2019), Microsoft Windows KB4054519, and KB4056898 |
| JVM Instance | ssj_ops@100% |
|---|---|
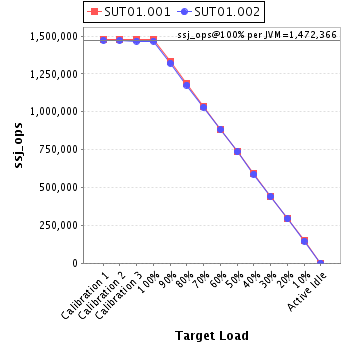
| SUT01.001 | 1,477,718 |
| SUT01.002 | 1,467,014 |
| ssj_ops@100% | 2,944,732 |
| ssj_ops@100% per JVM | 1,472,366 |
| Target Load | Actual Load | ssj_ops | |
|---|---|---|---|
| Target | Actual | ||
| Calibration 1 | 1,476,770 | ||
| Calibration 2 | 1,479,162 | ||
| Calibration 3 | 1,476,604 | ||
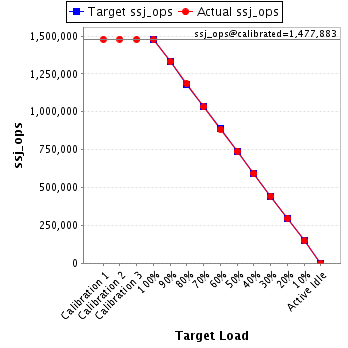
| ssj_ops@calibrated=1,477,883 | |||
| 100% | 100.0% | 1,477,883 | 1,477,718 |
| 90% | 90.0% | 1,330,094 | 1,329,882 |
| 80% | 80.1% | 1,182,306 | 1,184,071 |
| 70% | 69.8% | 1,034,518 | 1,032,136 |
| 60% | 59.9% | 886,730 | 884,981 |
| 50% | 50.0% | 738,941 | 739,397 |
| 40% | 40.1% | 591,153 | 591,918 |
| 30% | 30.0% | 443,365 | 443,865 |
| 20% | 20.0% | 295,577 | 295,690 |
| 10% | 10.0% | 147,788 | 148,459 |
| Active Idle | 0 | 0 | |
| Target Load | Actual Load | ssj_ops | |
|---|---|---|---|
| Target | Actual | ||
| Calibration 1 | 1,472,757 | ||
| Calibration 2 | 1,472,005 | ||
| Calibration 3 | 1,466,956 | ||
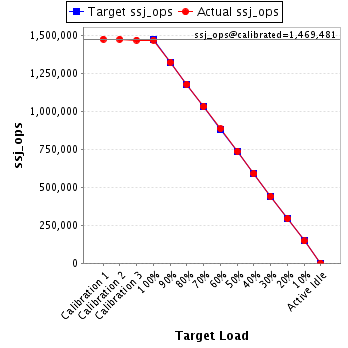
| ssj_ops@calibrated=1,469,481 | |||
| 100% | 99.8% | 1,469,481 | 1,467,014 |
| 90% | 89.9% | 1,322,533 | 1,321,255 |
| 80% | 80.0% | 1,175,584 | 1,175,871 |
| 70% | 70.1% | 1,028,636 | 1,030,270 |
| 60% | 60.2% | 881,688 | 883,983 |
| 50% | 50.1% | 734,740 | 735,525 |
| 40% | 40.0% | 587,792 | 587,946 |
| 30% | 30.0% | 440,844 | 440,357 |
| 20% | 20.0% | 293,896 | 293,307 |
| 10% | 10.0% | 146,948 | 146,514 |
| Active Idle | 0 | 0 | |