
SPECpower_ssj2008
Host 'SY480-02' Performance Report
Copyright © 2007-2019 Standard Performance Evaluation Corporation
| Hewlett Packard Enterprise Synergy 480 Gen10 Compute Module | ssj_ops@100% = 5,888,706 ssj_ops@100% per JVM = 1,472,176 |
||||
| Test Sponsor: | Hewlett Packard Enterprise | SPEC License #: | 3 | Test Method: | Multi Node |
| Tested By: | Hewlett Packard Enterprise | Test Location: | Houston, TX, USA | Test Date: | Mar 12, 2019 |
| Hardware Availability: | Apr-2019 | Software Availability: | Mar-2019 | Publication: | Apr 2, 2019 |
| System Source: | Single Supplier | System Designation: | Server | Power Provisioning: | Line-powered |
| Target Load | Actual Load | ssj_ops | |
|---|---|---|---|
| Target | Actual | ||
| Calibration 1 | 5,914,898 | ||
| Calibration 2 | 5,911,978 | ||
| Calibration 3 | 5,910,397 | ||
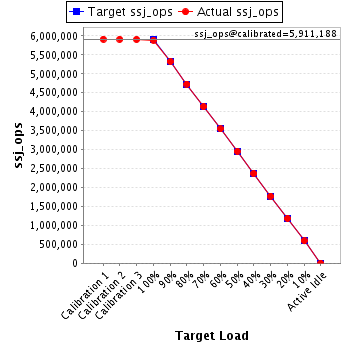
| ssj_ops@calibrated=5,911,188 | |||
| 100% | 99.6% | 5,911,188 | 5,888,706 |
| 90% | 90.1% | 5,320,069 | 5,324,128 |
| 80% | 80.0% | 4,728,950 | 4,730,683 |
| 70% | 70.0% | 4,137,831 | 4,135,323 |
| 60% | 60.0% | 3,546,713 | 3,545,174 |
| 50% | 50.0% | 2,955,594 | 2,957,486 |
| 40% | 40.0% | 2,364,475 | 2,367,361 |
| 30% | 30.0% | 1,773,356 | 1,773,704 |
| 20% | 20.1% | 1,182,238 | 1,185,614 |
| 10% | 10.0% | 591,119 | 591,801 |
| Active Idle | 0 | 0 | |
| Set Identifier: | SUT |
| Set Description: | System Under Test |
| # of Identical Nodes: | 7 |
| Comment: | SUT |
| Hardware | |
|---|---|
| Hardware Vendor: | Hewlett Packard Enterprise |
| Model: | Synergy 480 Gen10 Compute Module |
| Form Factor: | blade |
| CPU Name: | Intel Xeon Platinum 8280 @ 2.70GHz |
| CPU Characteristics: | 28-Core, 2.70 GHz, 38.5MB L3 Cache |
| CPU Frequency (MHz): | 2700 |
| CPU(s) Enabled: | 56 cores, 2 chips, 28 cores/chip |
| Hardware Threads: | 112 (2 / core) |
| CPU(s) Orderable: | 1,2 chips |
| Primary Cache: | 32 KB I + 32 KB D on chip per core |
| Secondary Cache: | 1 MB I+D on chip per core |
| Tertiary Cache: | 39424 KB I+D on chip per chip |
| Other Cache: | None |
| Memory Amount (GB): | 192 |
| # and size of DIMM: | 12 x 16384 MB |
| Memory Details: | 12 x 16GB 2Rx8 PC4-2933Y-R; slots 1, 3, 5, 8, 10 and 12 populated on each socket |
| Power Supply Quantity and Rating (W): | None |
| Power Supply Details: | N/A |
| Disk Drive: | 1 x HPE 480GB SATA 6G M.2 2280 (875498-B21) |
| Disk Controller: | HPE Smart Array S100i SR Gen10 |
| # and type of Network Interface Cards (NICs) Installed: | 1 x HPE Synergy 3820C 10/20Gb CNA |
| NICs Enabled in Firmware / OS / Connected: | 2/2/1 |
| Network Speed (Mbit): | 1000 |
| Keyboard: | None |
| Mouse: | None |
| Monitor: | None |
| Optical Drives: | No |
| Other Hardware: | None |
| Software | |
|---|---|
| Power Management: | Enabled (see SUT Notes) |
| Operating System (OS): | SUSE Linux Enterprise Server 12 SP4 |
| OS Version: | 4.12.14-94.41-default |
| Filesystem: | xfs |
| JVM Vendor: | Oracle Corporation |
| JVM Version: | Oracle Java HotSpot(TM) 64-Bit Server VM (build 24.80-b11, mixed mode), version 1.7.0_80 |
| JVM Command-line Options: | -server -Xmn19g -Xms21g -Xmx21g -XX:SurvivorRatio=1 -XX:TargetSurvivorRatio=99 -XX:AllocatePrefetchDistance=384 -XX:AllocatePrefetchLines=4 -XX:LoopUnrollLimit=37 -XX:InitialTenuringThreshold=12 -XX:MaxTenuringThreshold=15 -XX:ParallelGCThreads=28 -XX:InlineSmallCode=3900 -XX:MaxInlineSize=270 -XX:FreqInlineSize=2500 -XX:+AggressiveOpts -XX:+UseLargePages -XX:+UseParallelOldGC |
| JVM Affinity: | numactl --cpunodebind=[0-3] --localalloc |
| JVM Instances: | 4 |
| JVM Initial Heap (MB): | 21000 |
| JVM Maximum Heap (MB): | 21000 |
| JVM Address Bits: | 64 |
| Boot Firmware Version: | I42 v2.00 (02/02/2019) |
| Management Firmware Version: | 1.40 Feb 05 2019 |
| Workload Version: | SSJ 1.2.10 |
| Director Location: | Controller |
| Other Software: | HPE Service Pack for ProLiant (SPP) - Version 2019.03.0 (Mar 2019) |
| JVM Instance | ssj_ops@100% |
|---|---|
| SY480-02.001 | 1,478,246 |
| SY480-02.002 | 1,488,015 |
| SY480-02.003 | 1,467,677 |
| SY480-02.004 | 1,454,768 |
| ssj_ops@100% | 5,888,706 |
| ssj_ops@100% per JVM | 1,472,176 |

| Target Load | Actual Load | ssj_ops | |
|---|---|---|---|
| Target | Actual | ||
| Calibration 1 | 1,484,063 | ||
| Calibration 2 | 1,486,655 | ||
| Calibration 3 | 1,481,410 | ||
| ssj_ops@calibrated=1,484,033 | |||
| 100% | 99.6% | 1,484,033 | 1,478,246 |
| 90% | 90.4% | 1,335,629 | 1,340,831 |
| 80% | 80.1% | 1,187,226 | 1,189,323 |
| 70% | 70.0% | 1,038,823 | 1,039,387 |
| 60% | 60.2% | 890,420 | 892,835 |
| 50% | 50.2% | 742,016 | 745,008 |
| 40% | 40.0% | 593,613 | 594,126 |
| 30% | 29.9% | 445,210 | 444,036 |
| 20% | 20.0% | 296,807 | 297,497 |
| 10% | 10.0% | 148,403 | 148,787 |
| Active Idle | 0 | 0 | |

| Target Load | Actual Load | ssj_ops | |
|---|---|---|---|
| Target | Actual | ||
| Calibration 1 | 1,492,344 | ||
| Calibration 2 | 1,490,272 | ||
| Calibration 3 | 1,491,035 | ||
| ssj_ops@calibrated=1,490,654 | |||
| 100% | 99.8% | 1,490,654 | 1,488,015 |
| 90% | 90.1% | 1,341,588 | 1,343,005 |
| 80% | 80.0% | 1,192,523 | 1,192,866 |
| 70% | 69.9% | 1,043,458 | 1,041,524 |
| 60% | 59.8% | 894,392 | 891,869 |
| 50% | 50.1% | 745,327 | 747,294 |
| 40% | 40.1% | 596,261 | 597,269 |
| 30% | 30.1% | 447,196 | 448,407 |
| 20% | 20.1% | 298,131 | 299,601 |
| 10% | 10.0% | 149,065 | 148,653 |
| Active Idle | 0 | 0 | |

| Target Load | Actual Load | ssj_ops | |
|---|---|---|---|
| Target | Actual | ||
| Calibration 1 | 1,473,069 | ||
| Calibration 2 | 1,473,135 | ||
| Calibration 3 | 1,473,666 | ||
| ssj_ops@calibrated=1,473,401 | |||
| 100% | 99.6% | 1,473,401 | 1,467,677 |
| 90% | 89.8% | 1,326,061 | 1,322,808 |
| 80% | 80.0% | 1,178,721 | 1,179,141 |
| 70% | 70.0% | 1,031,381 | 1,031,501 |
| 60% | 59.9% | 884,041 | 882,594 |
| 50% | 49.9% | 736,700 | 735,838 |
| 40% | 40.0% | 589,360 | 589,152 |
| 30% | 30.1% | 442,020 | 443,036 |
| 20% | 19.9% | 294,680 | 293,660 |
| 10% | 10.0% | 147,340 | 147,412 |
| Active Idle | 0 | 0 | |

| Target Load | Actual Load | ssj_ops | |
|---|---|---|---|
| Target | Actual | ||
| Calibration 1 | 1,465,422 | ||
| Calibration 2 | 1,461,915 | ||
| Calibration 3 | 1,464,286 | ||
| ssj_ops@calibrated=1,463,100 | |||
| 100% | 99.4% | 1,463,100 | 1,454,768 |
| 90% | 90.0% | 1,316,790 | 1,317,484 |
| 80% | 79.9% | 1,170,480 | 1,169,353 |
| 70% | 69.9% | 1,024,170 | 1,022,910 |
| 60% | 60.0% | 877,860 | 877,876 |
| 50% | 49.8% | 731,550 | 729,346 |
| 40% | 40.1% | 585,240 | 586,814 |
| 30% | 30.0% | 438,930 | 438,225 |
| 20% | 20.2% | 292,620 | 294,855 |
| 10% | 10.0% | 146,310 | 146,949 |
| Active Idle | 0 | 0 | |
