SPECpower_ssj2008
Aggregate Performance Report
Copyright © 2007-2019 Standard Performance Evaluation Corporation
| Hewlett Packard Enterprise Synergy 480 Gen10 Compute Module | ssj_ops@100% = 47,287,215 ssj_ops@100% per Host = 5,910,902 ssj_ops@100% per JVM = 1,477,725 |
||||
| Test Sponsor: | Hewlett Packard Enterprise | SPEC License #: | 3 | Test Method: | Multi Node |
| Tested By: | Hewlett Packard Enterprise | Test Location: | Houston, TX, USA | Test Date: | Mar 12, 2019 |
| Hardware Availability: | Apr-2019 | Software Availability: | Mar-2019 | Publication: | Apr 2, 2019 |
| System Source: | Single Supplier | System Designation: | Server | Power Provisioning: | Line-powered |
| Target Load | Actual Load | ssj_ops | |
|---|---|---|---|
| Target | Actual | ||
| Calibration 1 | 47,491,815 | ||
| Calibration 2 | 47,407,273 | ||
| Calibration 3 | 47,443,600 | ||
| ssj_ops@calibrated=47,425,437 | |||
| 100% | 99.7% | 47,425,437 | 47,287,215 |
| 90% | 90.0% | 42,682,893 | 42,695,792 |
| 80% | 80.0% | 37,940,349 | 37,961,133 |
| 70% | 70.0% | 33,197,806 | 33,186,535 |
| 60% | 60.0% | 28,455,262 | 28,441,805 |
| 50% | 50.0% | 23,712,718 | 23,711,234 |
| 40% | 40.0% | 18,970,175 | 18,956,875 |
| 30% | 30.0% | 14,227,631 | 14,227,491 |
| 20% | 20.0% | 9,485,087 | 9,487,011 |
| 10% | 10.0% | 4,742,544 | 4,743,650 |
| Active Idle | 0 | 0 | |

| # of Nodes | # of Chips | # of Cores | # of Threads | Total RAM (GB) | # of OS Images | # of JVM Instances |
|---|---|---|---|---|---|---|
| 8 | 16 | 448 | 896 | 1,536 | 8 | 32 |
| Set Identifier: | SUT |
| Set Description: | System Under Test |
| # of Identical Nodes: | 8 |
| Comment: | SUT |
| Hardware per Node | |
|---|---|
| Hardware Vendor: | Hewlett Packard Enterprise |
| Model: | Synergy 480 Gen10 Compute Module |
| Form Factor: | blade |
| CPU Name: | Intel Xeon Platinum 8280 @ 2.70GHz |
| CPU Characteristics: | 28-Core, 2.70 GHz, 38.5MB L3 Cache |
| CPU Frequency (MHz): | 2700 |
| CPU(s) Enabled: | 56 cores, 2 chips, 28 cores/chip |
| Hardware Threads: | 112 (2 / core) |
| CPU(s) Orderable: | 1,2 chips |
| Primary Cache: | 32 KB I + 32 KB D on chip per core |
| Secondary Cache: | 1 MB I+D on chip per core |
| Tertiary Cache: | 39424 KB I+D on chip per chip |
| Other Cache: | None |
| Memory Amount (GB): | 192 |
| # and size of DIMM: | 12 x 16384 MB |
| Memory Details: | 12 x 16GB 2Rx8 PC4-2933Y-R; slots 1, 3, 5, 8, 10 and 12 populated on each socket |
| Power Supply Quantity and Rating (W): | None |
| Power Supply Details: | N/A |
| Disk Drive: | 1 x HPE 480GB SATA 6G M.2 2280 (875498-B21) |
| Disk Controller: | HPE Smart Array S100i SR Gen10 |
| # and type of Network Interface Cards (NICs) Installed: | 1 x HPE Synergy 3820C 10/20Gb CNA |
| NICs Enabled in Firmware / OS / Connected: | 2/2/1 |
| Network Speed (Mbit): | 1000 |
| Keyboard: | None |
| Mouse: | None |
| Monitor: | None |
| Optical Drives: | No |
| Other Hardware: | None |
| Software per Node | |
|---|---|
| Power Management: | Enabled (see SUT Notes) |
| Operating System (OS): | SUSE Linux Enterprise Server 12 SP4 |
| OS Version: | 4.12.14-94.41-default |
| Filesystem: | xfs |
| JVM Vendor: | Oracle Corporation |
| JVM Version: | Oracle Java HotSpot(TM) 64-Bit Server VM (build 24.80-b11, mixed mode), version 1.7.0_80 |
| JVM Command-line Options: | -server -Xmn19g -Xms21g -Xmx21g -XX:SurvivorRatio=1 -XX:TargetSurvivorRatio=99 -XX:AllocatePrefetchDistance=384 -XX:AllocatePrefetchLines=4 -XX:LoopUnrollLimit=37 -XX:InitialTenuringThreshold=12 -XX:MaxTenuringThreshold=15 -XX:ParallelGCThreads=28 -XX:InlineSmallCode=3900 -XX:MaxInlineSize=270 -XX:FreqInlineSize=2500 -XX:+AggressiveOpts -XX:+UseLargePages -XX:+UseParallelOldGC |
| JVM Affinity: | numactl --cpunodebind=[0-3] --localalloc |
| JVM Instances: | 4 |
| JVM Initial Heap (MB): | 21000 |
| JVM Maximum Heap (MB): | 21000 |
| JVM Address Bits: | 64 |
| Boot Firmware Version: | I42 v2.00 (02/02/2019) |
| Management Firmware Version: | 1.40 Feb 05 2019 |
| Workload Version: | SSJ 1.2.10 |
| Director Location: | Controller |
| Other Software: | HPE Service Pack for ProLiant (SPP) - Version 2019.03.0 (Mar 2019) |
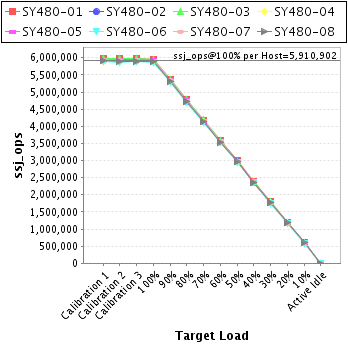
| Host | ssj_ops@100% |
|---|---|
| SY480-01 | 5,957,554 |
| SY480-02 | 5,910,124 |
| SY480-03 | 5,951,683 |
| SY480-04 | 5,887,969 |
| SY480-05 | 5,924,096 |
| SY480-06 | 5,853,301 |
| SY480-07 | 5,915,251 |
| SY480-08 | 5,887,236 |
| ssj_ops@100% | 47,287,215 |
| ssj_ops@100% per Host | 5,910,902 |
| ssj_ops@100% per JVM | 1,477,725 |
| Target Load | Actual Load | ssj_ops | |
|---|---|---|---|
| Target | Actual | ||
| Calibration 1 | 5,988,912 | ||
| Calibration 2 | 5,973,658 | ||
| Calibration 3 | 5,976,499 | ||
| ssj_ops@calibrated=5,975,079 | |||
| 100% | 99.7% | 5,975,079 | 5,957,554 |
| 90% | 90.0% | 5,377,571 | 5,375,035 |
| 80% | 80.0% | 4,780,063 | 4,780,398 |
| 70% | 69.8% | 4,182,555 | 4,172,131 |
| 60% | 59.9% | 3,585,047 | 3,581,078 |
| 50% | 50.0% | 2,987,539 | 2,986,572 |
| 40% | 40.0% | 2,390,031 | 2,391,704 |
| 30% | 30.1% | 1,792,524 | 1,797,478 |
| 20% | 20.0% | 1,195,016 | 1,197,001 |
| 10% | 10.0% | 597,508 | 596,482 |
| Active Idle | 0 | 0 | |

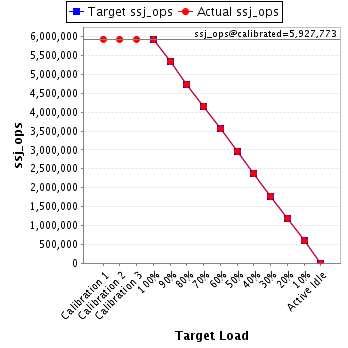
| Target Load | Actual Load | ssj_ops | |
|---|---|---|---|
| Target | Actual | ||
| Calibration 1 | 5,931,378 | ||
| Calibration 2 | 5,925,469 | ||
| Calibration 3 | 5,930,078 | ||
| ssj_ops@calibrated=5,927,773 | |||
| 100% | 99.7% | 5,927,773 | 5,910,124 |
| 90% | 90.1% | 5,334,996 | 5,343,222 |
| 80% | 79.9% | 4,742,219 | 4,733,930 |
| 70% | 70.0% | 4,149,441 | 4,151,580 |
| 60% | 60.0% | 3,556,664 | 3,556,027 |
| 50% | 50.1% | 2,963,887 | 2,968,268 |
| 40% | 40.0% | 2,371,109 | 2,370,340 |
| 30% | 30.0% | 1,778,332 | 1,778,222 |
| 20% | 20.0% | 1,185,555 | 1,186,722 |
| 10% | 10.0% | 592,777 | 593,781 |
| Active Idle | 0 | 0 | |
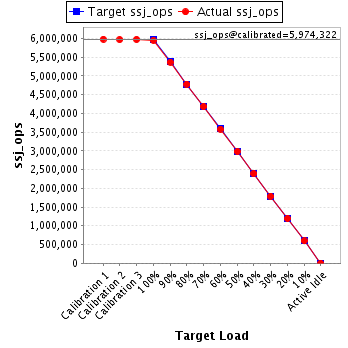
| Target Load | Actual Load | ssj_ops | |
|---|---|---|---|
| Target | Actual | ||
| Calibration 1 | 5,982,238 | ||
| Calibration 2 | 5,970,464 | ||
| Calibration 3 | 5,978,179 | ||
| ssj_ops@calibrated=5,974,322 | |||
| 100% | 99.6% | 5,974,322 | 5,951,683 |
| 90% | 89.9% | 5,376,889 | 5,368,782 |
| 80% | 80.0% | 4,779,457 | 4,781,089 |
| 70% | 70.0% | 4,182,025 | 4,184,948 |
| 60% | 60.0% | 3,584,593 | 3,583,254 |
| 50% | 50.0% | 2,987,161 | 2,984,995 |
| 40% | 40.0% | 2,389,729 | 2,390,317 |
| 30% | 30.0% | 1,792,296 | 1,790,596 |
| 20% | 20.0% | 1,194,864 | 1,196,406 |
| 10% | 10.0% | 597,432 | 595,997 |
| Active Idle | 0 | 0 | |
| Target Load | Actual Load | ssj_ops | |
|---|---|---|---|
| Target | Actual | ||
| Calibration 1 | 5,903,556 | ||
| Calibration 2 | 5,895,415 | ||
| Calibration 3 | 5,902,374 | ||
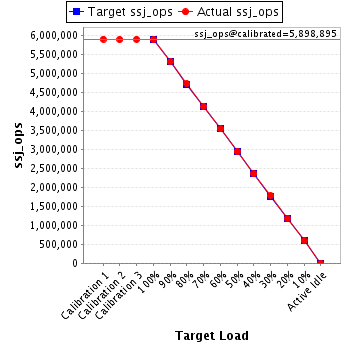
| ssj_ops@calibrated=5,898,895 | |||
| 100% | 99.8% | 5,898,895 | 5,887,969 |
| 90% | 90.0% | 5,309,005 | 5,306,714 |
| 80% | 80.2% | 4,719,116 | 4,728,316 |
| 70% | 70.0% | 4,129,226 | 4,128,276 |
| 60% | 60.0% | 3,539,337 | 3,539,136 |
| 50% | 49.9% | 2,949,447 | 2,943,622 |
| 40% | 39.9% | 2,359,558 | 2,354,030 |
| 30% | 30.1% | 1,769,668 | 1,773,745 |
| 20% | 20.0% | 1,179,779 | 1,177,160 |
| 10% | 10.0% | 589,889 | 588,440 |
| Active Idle | 0 | 0 | |
| Target Load | Actual Load | ssj_ops | |
|---|---|---|---|
| Target | Actual | ||
| Calibration 1 | 5,947,183 | ||
| Calibration 2 | 5,943,069 | ||
| Calibration 3 | 5,943,316 | ||
| ssj_ops@calibrated=5,943,193 | |||
| 100% | 99.7% | 5,943,193 | 5,924,096 |
| 90% | 90.0% | 5,348,873 | 5,350,569 |
| 80% | 80.1% | 4,754,554 | 4,762,676 |
| 70% | 70.0% | 4,160,235 | 4,158,909 |
| 60% | 60.0% | 3,565,916 | 3,566,341 |
| 50% | 50.0% | 2,971,596 | 2,970,657 |
| 40% | 40.0% | 2,377,277 | 2,377,593 |
| 30% | 30.0% | 1,782,958 | 1,783,121 |
| 20% | 20.1% | 1,188,639 | 1,192,184 |
| 10% | 10.0% | 594,319 | 594,360 |
| Active Idle | 0 | 0 | |

| Target Load | Actual Load | ssj_ops | |
|---|---|---|---|
| Target | Actual | ||
| Calibration 1 | 5,885,569 | ||
| Calibration 2 | 5,866,973 | ||
| Calibration 3 | 5,877,828 | ||
| ssj_ops@calibrated=5,872,400 | |||
| 100% | 99.7% | 5,872,400 | 5,853,301 |
| 90% | 90.1% | 5,285,160 | 5,290,655 |
| 80% | 80.1% | 4,697,920 | 4,701,188 |
| 70% | 69.9% | 4,110,680 | 4,105,264 |
| 60% | 60.0% | 3,523,440 | 3,524,305 |
| 50% | 50.0% | 2,936,200 | 2,934,069 |
| 40% | 40.0% | 2,348,960 | 2,346,279 |
| 30% | 29.9% | 1,761,720 | 1,758,153 |
| 20% | 20.0% | 1,174,480 | 1,173,000 |
| 10% | 10.0% | 587,240 | 589,405 |
| Active Idle | 0 | 0 | |

| Target Load | Actual Load | ssj_ops | |
|---|---|---|---|
| Target | Actual | ||
| Calibration 1 | 5,941,487 | ||
| Calibration 2 | 5,926,971 | ||
| Calibration 3 | 5,929,725 | ||
| ssj_ops@calibrated=5,928,348 | |||
| 100% | 99.8% | 5,928,348 | 5,915,251 |
| 90% | 90.1% | 5,335,513 | 5,341,532 |
| 80% | 80.1% | 4,742,678 | 4,746,864 |
| 70% | 70.1% | 4,149,844 | 4,156,327 |
| 60% | 60.0% | 3,557,009 | 3,555,982 |
| 50% | 50.0% | 2,964,174 | 2,965,727 |
| 40% | 40.0% | 2,371,339 | 2,369,245 |
| 30% | 29.9% | 1,778,504 | 1,773,586 |
| 20% | 20.0% | 1,185,670 | 1,185,161 |
| 10% | 10.0% | 592,835 | 593,382 |
| Active Idle | 0 | 0 | |

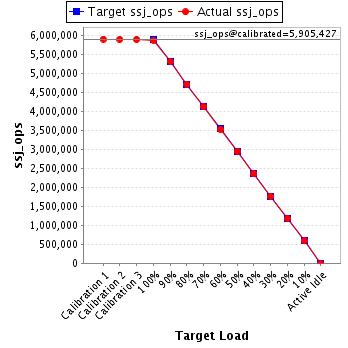
| Target Load | Actual Load | ssj_ops | |
|---|---|---|---|
| Target | Actual | ||
| Calibration 1 | 5,911,491 | ||
| Calibration 2 | 5,905,253 | ||
| Calibration 3 | 5,905,601 | ||
| ssj_ops@calibrated=5,905,427 | |||
| 100% | 99.7% | 5,905,427 | 5,887,236 |
| 90% | 90.1% | 5,314,885 | 5,319,284 |
| 80% | 80.0% | 4,724,342 | 4,726,671 |
| 70% | 69.9% | 4,133,799 | 4,129,099 |
| 60% | 59.9% | 3,543,256 | 3,535,683 |
| 50% | 50.1% | 2,952,714 | 2,957,323 |
| 40% | 39.9% | 2,362,171 | 2,357,368 |
| 30% | 30.0% | 1,771,628 | 1,772,590 |
| 20% | 20.0% | 1,181,085 | 1,179,377 |
| 10% | 10.0% | 590,543 | 591,802 |
| Active Idle | 0 | 0 | |