SPECpower_ssj2008
Host 'SY480-08' Performance Report
Copyright © 2007-2019 Standard Performance Evaluation Corporation
| Hewlett Packard Enterprise Synergy 480 Gen10 Compute Module | ssj_ops@100% = 5,917,233 ssj_ops@100% per JVM = 1,479,308 |
||||
| Test Sponsor: | Hewlett Packard Enterprise | SPEC License #: | 3 | Test Method: | Multi Node |
| Tested By: | Hewlett Packard Enterprise | Test Location: | Houston, TX, USA | Test Date: | Mar 12, 2019 |
| Hardware Availability: | Apr-2019 | Software Availability: | Mar-2019 | Publication: | Apr 2, 2019 |
| System Source: | Single Supplier | System Designation: | Server | Power Provisioning: | Line-powered |
| Target Load | Actual Load | ssj_ops | |
|---|---|---|---|
| Target | Actual | ||
| Calibration 1 | 5,943,992 | ||
| Calibration 2 | 5,932,068 | ||
| Calibration 3 | 5,936,592 | ||
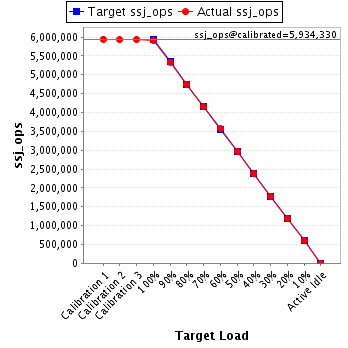
| ssj_ops@calibrated=5,934,330 | |||
| 100% | 99.7% | 5,934,330 | 5,917,233 |
| 90% | 89.9% | 5,340,897 | 5,335,794 |
| 80% | 80.0% | 4,747,464 | 4,747,087 |
| 70% | 70.0% | 4,154,031 | 4,153,731 |
| 60% | 60.1% | 3,560,598 | 3,567,473 |
| 50% | 50.1% | 2,967,165 | 2,974,561 |
| 40% | 39.9% | 2,373,732 | 2,370,415 |
| 30% | 30.0% | 1,780,299 | 1,780,166 |
| 20% | 20.1% | 1,186,866 | 1,189,972 |
| 10% | 10.0% | 593,433 | 593,985 |
| Active Idle | 0 | 0 | |
| Set Identifier: | SUT |
| Set Description: | System Under Test |
| # of Identical Nodes: | 10 |
| Comment: | SUT |
| Hardware | |
|---|---|
| Hardware Vendor: | Hewlett Packard Enterprise |
| Model: | Synergy 480 Gen10 Compute Module |
| Form Factor: | blade |
| CPU Name: | Intel Xeon Platinum 8280 @ 2.70GHz |
| CPU Characteristics: | 28-Core, 2.70 GHz, 38.5MB L3 Cache |
| CPU Frequency (MHz): | 2700 |
| CPU(s) Enabled: | 56 cores, 2 chips, 28 cores/chip |
| Hardware Threads: | 112 (2 / core) |
| CPU(s) Orderable: | 1,2 chips |
| Primary Cache: | 32 KB I + 32 KB D on chip per core |
| Secondary Cache: | 1 MB I+D on chip per core |
| Tertiary Cache: | 39424 KB I+D on chip per chip |
| Other Cache: | None |
| Memory Amount (GB): | 192 |
| # and size of DIMM: | 12 x 16384 MB |
| Memory Details: | 12 x 16GB 2Rx8 PC4-2933Y-R; slots 1, 3, 5, 8, 10 and 12 populated on each socket |
| Power Supply Quantity and Rating (W): | None |
| Power Supply Details: | N/A |
| Disk Drive: | 1 x HPE 480GB SATA 6G M.2 2280 (875498-B21) |
| Disk Controller: | HPE Smart Array S100i SR Gen10 |
| # and type of Network Interface Cards (NICs) Installed: | 1 x HPE Synergy 3820C 10/20Gb CNA |
| NICs Enabled in Firmware / OS / Connected: | 2/2/1 |
| Network Speed (Mbit): | 1000 |
| Keyboard: | None |
| Mouse: | None |
| Monitor: | None |
| Optical Drives: | No |
| Other Hardware: | None |
| Software | |
|---|---|
| Power Management: | Enabled (see SUT Notes) |
| Operating System (OS): | SUSE Linux Enterprise Server 12 SP4 |
| OS Version: | 4.12.14-94.41-default |
| Filesystem: | xfs |
| JVM Vendor: | Oracle Corporation |
| JVM Version: | Oracle Java HotSpot(TM) 64-Bit Server VM (build 24.80-b11, mixed mode), version 1.7.0_80 |
| JVM Command-line Options: | -server -Xmn19g -Xms21g -Xmx21g -XX:SurvivorRatio=1 -XX:TargetSurvivorRatio=99 -XX:AllocatePrefetchDistance=384 -XX:AllocatePrefetchLines=4 -XX:LoopUnrollLimit=37 -XX:InitialTenuringThreshold=12 -XX:MaxTenuringThreshold=15 -XX:ParallelGCThreads=28 -XX:InlineSmallCode=3900 -XX:MaxInlineSize=270 -XX:FreqInlineSize=2500 -XX:+AggressiveOpts -XX:+UseLargePages -XX:+UseParallelOldGC |
| JVM Affinity: | numactl --cpunodebind=[0-3] --localalloc |
| JVM Instances: | 4 |
| JVM Initial Heap (MB): | 21000 |
| JVM Maximum Heap (MB): | 21000 |
| JVM Address Bits: | 64 |
| Boot Firmware Version: | I42 v2.00 (02/02/2019) |
| Management Firmware Version: | 1.40 Feb 05 2019 |
| Workload Version: | SSJ 1.2.10 |
| Director Location: | Controller |
| Other Software: | HPE Service Pack for ProLiant (SPP) - Version 2019.03.0 (Mar 2019) |
| JVM Instance | ssj_ops@100% |
|---|---|
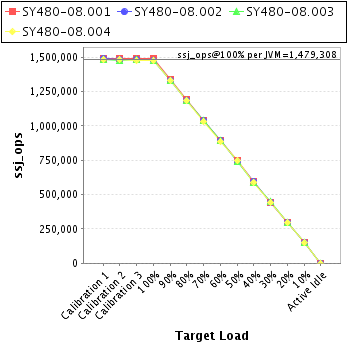
| SY480-08.001 | 1,487,574 |
| SY480-08.002 | 1,478,254 |
| SY480-08.003 | 1,475,223 |
| SY480-08.004 | 1,476,181 |
| ssj_ops@100% | 5,917,233 |
| ssj_ops@100% per JVM | 1,479,308 |
| Target Load | Actual Load | ssj_ops | |
|---|---|---|---|
| Target | Actual | ||
| Calibration 1 | 1,492,482 | ||
| Calibration 2 | 1,490,451 | ||
| Calibration 3 | 1,492,233 | ||
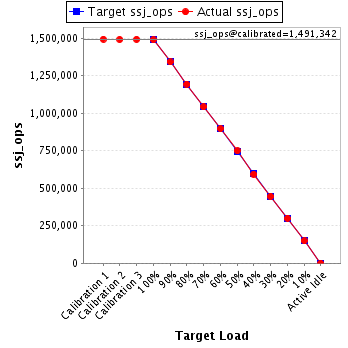
| ssj_ops@calibrated=1,491,342 | |||
| 100% | 99.7% | 1,491,342 | 1,487,574 |
| 90% | 89.9% | 1,342,208 | 1,340,806 |
| 80% | 80.0% | 1,193,073 | 1,193,071 |
| 70% | 69.8% | 1,043,939 | 1,041,677 |
| 60% | 60.1% | 894,805 | 895,571 |
| 50% | 50.2% | 745,671 | 748,186 |
| 40% | 39.8% | 596,537 | 593,440 |
| 30% | 29.9% | 447,403 | 445,529 |
| 20% | 20.1% | 298,268 | 300,245 |
| 10% | 10.0% | 149,134 | 149,236 |
| Active Idle | 0 | 0 | |
| Target Load | Actual Load | ssj_ops | |
|---|---|---|---|
| Target | Actual | ||
| Calibration 1 | 1,486,797 | ||
| Calibration 2 | 1,481,195 | ||
| Calibration 3 | 1,483,614 | ||
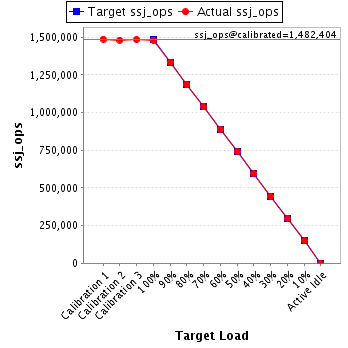
| ssj_ops@calibrated=1,482,404 | |||
| 100% | 99.7% | 1,482,404 | 1,478,254 |
| 90% | 89.9% | 1,334,164 | 1,332,502 |
| 80% | 80.1% | 1,185,924 | 1,187,125 |
| 70% | 70.1% | 1,037,683 | 1,038,798 |
| 60% | 60.1% | 889,443 | 890,204 |
| 50% | 50.0% | 741,202 | 740,770 |
| 40% | 40.2% | 592,962 | 595,205 |
| 30% | 30.0% | 444,721 | 445,409 |
| 20% | 20.1% | 296,481 | 298,182 |
| 10% | 10.0% | 148,240 | 148,673 |
| Active Idle | 0 | 0 | |
| Target Load | Actual Load | ssj_ops | |
|---|---|---|---|
| Target | Actual | ||
| Calibration 1 | 1,483,011 | ||
| Calibration 2 | 1,478,064 | ||
| Calibration 3 | 1,481,598 | ||
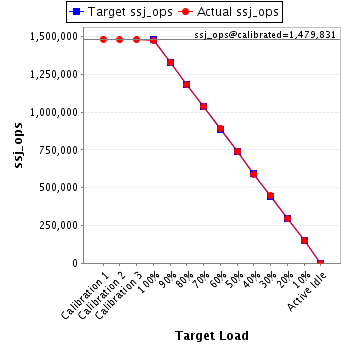
| ssj_ops@calibrated=1,479,831 | |||
| 100% | 99.7% | 1,479,831 | 1,475,223 |
| 90% | 89.9% | 1,331,848 | 1,329,993 |
| 80% | 79.9% | 1,183,865 | 1,182,553 |
| 70% | 70.2% | 1,035,882 | 1,038,853 |
| 60% | 60.4% | 887,899 | 894,451 |
| 50% | 50.0% | 739,915 | 740,325 |
| 40% | 39.9% | 591,932 | 590,409 |
| 30% | 30.1% | 443,949 | 445,997 |
| 20% | 20.0% | 295,966 | 295,328 |
| 10% | 10.0% | 147,983 | 147,989 |
| Active Idle | 0 | 0 | |
| Target Load | Actual Load | ssj_ops | |
|---|---|---|---|
| Target | Actual | ||
| Calibration 1 | 1,481,701 | ||
| Calibration 2 | 1,482,359 | ||
| Calibration 3 | 1,479,148 | ||
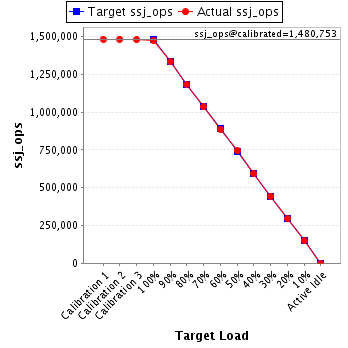
| ssj_ops@calibrated=1,480,753 | |||
| 100% | 99.7% | 1,480,753 | 1,476,181 |
| 90% | 90.0% | 1,332,678 | 1,332,493 |
| 80% | 80.0% | 1,184,603 | 1,184,337 |
| 70% | 69.9% | 1,036,527 | 1,034,403 |
| 60% | 59.9% | 888,452 | 887,246 |
| 50% | 50.3% | 740,377 | 745,279 |
| 40% | 39.9% | 592,301 | 591,360 |
| 30% | 29.9% | 444,226 | 443,231 |
| 20% | 20.0% | 296,151 | 296,217 |
| 10% | 10.0% | 148,075 | 148,086 |
| Active Idle | 0 | 0 | |