
SPECpower_ssj2008
Host 'SY480-07' Performance Report
Copyright © 2007-2019 Standard Performance Evaluation Corporation
| Hewlett Packard Enterprise Synergy 480 Gen10 Compute Module | ssj_ops@100% = 5,919,010 ssj_ops@100% per JVM = 1,479,752 |
||||
| Test Sponsor: | Hewlett Packard Enterprise | SPEC License #: | 3 | Test Method: | Multi Node |
| Tested By: | Hewlett Packard Enterprise | Test Location: | Houston, TX, USA | Test Date: | Mar 12, 2019 |
| Hardware Availability: | Apr-2019 | Software Availability: | Mar-2019 | Publication: | Apr 2, 2019 |
| System Source: | Single Supplier | System Designation: | Server | Power Provisioning: | Line-powered |
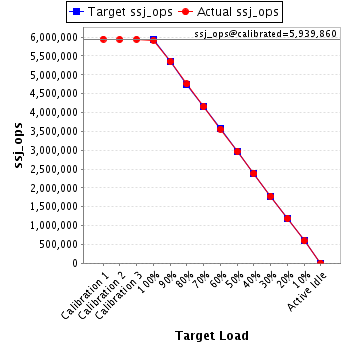
| Target Load | Actual Load | ssj_ops | |
|---|---|---|---|
| Target | Actual | ||
| Calibration 1 | 5,946,098 | ||
| Calibration 2 | 5,936,719 | ||
| Calibration 3 | 5,943,001 | ||
| ssj_ops@calibrated=5,939,860 | |||
| 100% | 99.6% | 5,939,860 | 5,919,010 |
| 90% | 90.1% | 5,345,874 | 5,354,222 |
| 80% | 80.1% | 4,751,888 | 4,757,683 |
| 70% | 70.0% | 4,157,902 | 4,155,576 |
| 60% | 60.0% | 3,563,916 | 3,561,505 |
| 50% | 49.9% | 2,969,930 | 2,965,078 |
| 40% | 40.0% | 2,375,944 | 2,377,602 |
| 30% | 30.0% | 1,781,958 | 1,780,640 |
| 20% | 20.0% | 1,187,972 | 1,186,749 |
| 10% | 10.0% | 593,986 | 592,703 |
| Active Idle | 0 | 0 | |
| Set Identifier: | SUT |
| Set Description: | System Under Test |
| # of Identical Nodes: | 11 |
| Comment: | SUT |
| Hardware | |
|---|---|
| Hardware Vendor: | Hewlett Packard Enterprise |
| Model: | Synergy 480 Gen10 Compute Module |
| Form Factor: | blade |
| CPU Name: | Intel Xeon Platinum 8280 @ 2.70GHz |
| CPU Characteristics: | 28-Core, 2.70 GHz, 38.5MB L3 Cache |
| CPU Frequency (MHz): | 2700 |
| CPU(s) Enabled: | 56 cores, 2 chips, 28 cores/chip |
| Hardware Threads: | 112 (2 / core) |
| CPU(s) Orderable: | 1,2 chips |
| Primary Cache: | 32 KB I + 32 KB D on chip per core |
| Secondary Cache: | 1 MB I+D on chip per core |
| Tertiary Cache: | 39424 KB I+D on chip per chip |
| Other Cache: | None |
| Memory Amount (GB): | 192 |
| # and size of DIMM: | 12 x 16384 MB |
| Memory Details: | 12 x 16GB 2Rx8 PC4-2933Y-R; slots 1, 3, 5, 8, 10 and 12 populated on each socket |
| Power Supply Quantity and Rating (W): | None |
| Power Supply Details: | N/A |
| Disk Drive: | 1 x HPE 480GB SATA 6G M.2 2280 (875498-B21) |
| Disk Controller: | HPE Smart Array S100i SR Gen10 |
| # and type of Network Interface Cards (NICs) Installed: | 1 x HPE Synergy 3820C 10/20Gb CNA |
| NICs Enabled in Firmware / OS / Connected: | 2/2/1 |
| Network Speed (Mbit): | 1000 |
| Keyboard: | None |
| Mouse: | None |
| Monitor: | None |
| Optical Drives: | No |
| Other Hardware: | None |
| Software | |
|---|---|
| Power Management: | Enabled (see SUT Notes) |
| Operating System (OS): | SUSE Linux Enterprise Server 12 SP4 |
| OS Version: | 4.12.14-94.41-default |
| Filesystem: | xfs |
| JVM Vendor: | Oracle Corporation |
| JVM Version: | Oracle Java HotSpot(TM) 64-Bit Server VM (build 24.80-b11, mixed mode), version 1.7.0_80 |
| JVM Command-line Options: | -server -Xmn19g -Xms21g -Xmx21g -XX:SurvivorRatio=1 -XX:TargetSurvivorRatio=99 -XX:AllocatePrefetchDistance=384 -XX:AllocatePrefetchLines=4 -XX:LoopUnrollLimit=37 -XX:InitialTenuringThreshold=12 -XX:MaxTenuringThreshold=15 -XX:ParallelGCThreads=28 -XX:InlineSmallCode=3900 -XX:MaxInlineSize=270 -XX:FreqInlineSize=2500 -XX:+AggressiveOpts -XX:+UseLargePages -XX:+UseParallelOldGC |
| JVM Affinity: | numactl --cpunodebind=[0-3] --localalloc |
| JVM Instances: | 4 |
| JVM Initial Heap (MB): | 21000 |
| JVM Maximum Heap (MB): | 21000 |
| JVM Address Bits: | 64 |
| Boot Firmware Version: | I42 v2.00 (02/02/2019) |
| Management Firmware Version: | 1.40 Feb 05 2019 |
| Workload Version: | SSJ 1.2.10 |
| Director Location: | Controller |
| Other Software: | HPE Service Pack for ProLiant (SPP) - Version 2019.03.0 (Mar 2019) |
| JVM Instance | ssj_ops@100% |
|---|---|
| SY480-07.001 | 1,467,274 |
| SY480-07.002 | 1,484,934 |
| SY480-07.003 | 1,469,462 |
| SY480-07.004 | 1,497,340 |
| ssj_ops@100% | 5,919,010 |
| ssj_ops@100% per JVM | 1,479,752 |

| Target Load | Actual Load | ssj_ops | |
|---|---|---|---|
| Target | Actual | ||
| Calibration 1 | 1,472,768 | ||
| Calibration 2 | 1,471,976 | ||
| Calibration 3 | 1,473,260 | ||
| ssj_ops@calibrated=1,472,618 | |||
| 100% | 99.6% | 1,472,618 | 1,467,274 |
| 90% | 90.1% | 1,325,356 | 1,326,196 |
| 80% | 80.2% | 1,178,095 | 1,180,759 |
| 70% | 69.9% | 1,030,833 | 1,029,531 |
| 60% | 60.1% | 883,571 | 884,350 |
| 50% | 50.0% | 736,309 | 736,496 |
| 40% | 39.9% | 589,047 | 587,615 |
| 30% | 30.1% | 441,785 | 442,666 |
| 20% | 19.9% | 294,524 | 293,458 |
| 10% | 9.9% | 147,262 | 146,466 |
| Active Idle | 0 | 0 | |

| Target Load | Actual Load | ssj_ops | |
|---|---|---|---|
| Target | Actual | ||
| Calibration 1 | 1,489,842 | ||
| Calibration 2 | 1,488,428 | ||
| Calibration 3 | 1,487,634 | ||
| ssj_ops@calibrated=1,488,031 | |||
| 100% | 99.8% | 1,488,031 | 1,484,934 |
| 90% | 90.2% | 1,339,228 | 1,341,550 |
| 80% | 79.7% | 1,190,425 | 1,185,468 |
| 70% | 69.8% | 1,041,622 | 1,039,142 |
| 60% | 59.9% | 892,818 | 891,413 |
| 50% | 49.9% | 744,015 | 742,171 |
| 40% | 40.0% | 595,212 | 595,651 |
| 30% | 30.0% | 446,409 | 446,462 |
| 20% | 20.0% | 297,606 | 296,922 |
| 10% | 10.0% | 148,803 | 149,019 |
| Active Idle | 0 | 0 | |

| Target Load | Actual Load | ssj_ops | |
|---|---|---|---|
| Target | Actual | ||
| Calibration 1 | 1,478,023 | ||
| Calibration 2 | 1,475,212 | ||
| Calibration 3 | 1,476,493 | ||
| ssj_ops@calibrated=1,475,853 | |||
| 100% | 99.6% | 1,475,853 | 1,469,462 |
| 90% | 90.3% | 1,328,267 | 1,332,888 |
| 80% | 80.3% | 1,180,682 | 1,185,037 |
| 70% | 69.9% | 1,033,097 | 1,031,102 |
| 60% | 60.0% | 885,512 | 885,066 |
| 50% | 49.9% | 737,926 | 736,766 |
| 40% | 40.1% | 590,341 | 591,788 |
| 30% | 29.9% | 442,756 | 440,855 |
| 20% | 20.0% | 295,171 | 294,625 |
| 10% | 10.0% | 147,585 | 146,914 |
| Active Idle | 0 | 0 | |

| Target Load | Actual Load | ssj_ops | |
|---|---|---|---|
| Target | Actual | ||
| Calibration 1 | 1,505,465 | ||
| Calibration 2 | 1,501,103 | ||
| Calibration 3 | 1,505,614 | ||
| ssj_ops@calibrated=1,503,358 | |||
| 100% | 99.6% | 1,503,358 | 1,497,340 |
| 90% | 90.0% | 1,353,023 | 1,353,588 |
| 80% | 80.2% | 1,202,687 | 1,206,419 |
| 70% | 70.2% | 1,052,351 | 1,055,801 |
| 60% | 59.9% | 902,015 | 900,677 |
| 50% | 49.9% | 751,679 | 749,644 |
| 40% | 40.1% | 601,343 | 602,549 |
| 30% | 30.0% | 451,008 | 450,657 |
| 20% | 20.1% | 300,672 | 301,744 |
| 10% | 10.0% | 150,336 | 150,304 |
| Active Idle | 0 | 0 | |
