
SPECpower_ssj2008
Host 'SY480-06' Performance Report
Copyright © 2007-2019 Standard Performance Evaluation Corporation
| Hewlett Packard Enterprise Synergy 480 Gen10 Compute Module | ssj_ops@100% = 5,903,152 ssj_ops@100% per JVM = 1,475,788 |
||||
| Test Sponsor: | Hewlett Packard Enterprise | SPEC License #: | 3 | Test Method: | Multi Node |
| Tested By: | Hewlett Packard Enterprise | Test Location: | Houston, TX, USA | Test Date: | Mar 12, 2019 |
| Hardware Availability: | Apr-2019 | Software Availability: | Mar-2019 | Publication: | Apr 2, 2019 |
| System Source: | Single Supplier | System Designation: | Server | Power Provisioning: | Line-powered |
| Target Load | Actual Load | ssj_ops | |
|---|---|---|---|
| Target | Actual | ||
| Calibration 1 | 5,927,210 | ||
| Calibration 2 | 5,912,343 | ||
| Calibration 3 | 5,920,360 | ||
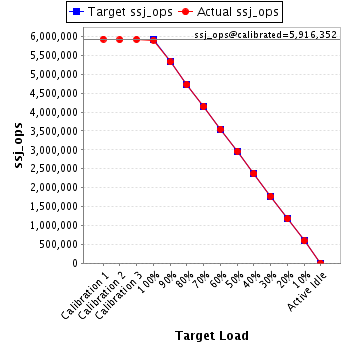
| ssj_ops@calibrated=5,916,352 | |||
| 100% | 99.8% | 5,916,352 | 5,903,152 |
| 90% | 90.0% | 5,324,716 | 5,327,117 |
| 80% | 79.9% | 4,733,081 | 4,725,618 |
| 70% | 70.1% | 4,141,446 | 4,145,615 |
| 60% | 60.0% | 3,549,811 | 3,550,455 |
| 50% | 50.1% | 2,958,176 | 2,961,208 |
| 40% | 40.0% | 2,366,541 | 2,366,891 |
| 30% | 30.0% | 1,774,905 | 1,774,724 |
| 20% | 19.9% | 1,183,270 | 1,178,044 |
| 10% | 10.0% | 591,635 | 593,517 |
| Active Idle | 0 | 0 | |
| Set Identifier: | SUT |
| Set Description: | System Under Test |
| # of Identical Nodes: | 11 |
| Comment: | SUT |
| Hardware | |
|---|---|
| Hardware Vendor: | Hewlett Packard Enterprise |
| Model: | Synergy 480 Gen10 Compute Module |
| Form Factor: | blade |
| CPU Name: | Intel Xeon Platinum 8280 @ 2.70GHz |
| CPU Characteristics: | 28-Core, 2.70 GHz, 38.5MB L3 Cache |
| CPU Frequency (MHz): | 2700 |
| CPU(s) Enabled: | 56 cores, 2 chips, 28 cores/chip |
| Hardware Threads: | 112 (2 / core) |
| CPU(s) Orderable: | 1,2 chips |
| Primary Cache: | 32 KB I + 32 KB D on chip per core |
| Secondary Cache: | 1 MB I+D on chip per core |
| Tertiary Cache: | 39424 KB I+D on chip per chip |
| Other Cache: | None |
| Memory Amount (GB): | 192 |
| # and size of DIMM: | 12 x 16384 MB |
| Memory Details: | 12 x 16GB 2Rx8 PC4-2933Y-R; slots 1, 3, 5, 8, 10 and 12 populated on each socket |
| Power Supply Quantity and Rating (W): | None |
| Power Supply Details: | N/A |
| Disk Drive: | 1 x HPE 480GB SATA 6G M.2 2280 (875498-B21) |
| Disk Controller: | HPE Smart Array S100i SR Gen10 |
| # and type of Network Interface Cards (NICs) Installed: | 1 x HPE Synergy 3820C 10/20Gb CNA |
| NICs Enabled in Firmware / OS / Connected: | 2/2/1 |
| Network Speed (Mbit): | 1000 |
| Keyboard: | None |
| Mouse: | None |
| Monitor: | None |
| Optical Drives: | No |
| Other Hardware: | None |
| Software | |
|---|---|
| Power Management: | Enabled (see SUT Notes) |
| Operating System (OS): | SUSE Linux Enterprise Server 12 SP4 |
| OS Version: | 4.12.14-94.41-default |
| Filesystem: | xfs |
| JVM Vendor: | Oracle Corporation |
| JVM Version: | Oracle Java HotSpot(TM) 64-Bit Server VM (build 24.80-b11, mixed mode), version 1.7.0_80 |
| JVM Command-line Options: | -server -Xmn19g -Xms21g -Xmx21g -XX:SurvivorRatio=1 -XX:TargetSurvivorRatio=99 -XX:AllocatePrefetchDistance=384 -XX:AllocatePrefetchLines=4 -XX:LoopUnrollLimit=37 -XX:InitialTenuringThreshold=12 -XX:MaxTenuringThreshold=15 -XX:ParallelGCThreads=28 -XX:InlineSmallCode=3900 -XX:MaxInlineSize=270 -XX:FreqInlineSize=2500 -XX:+AggressiveOpts -XX:+UseLargePages -XX:+UseParallelOldGC |
| JVM Affinity: | numactl --cpunodebind=[0-3] --localalloc |
| JVM Instances: | 4 |
| JVM Initial Heap (MB): | 21000 |
| JVM Maximum Heap (MB): | 21000 |
| JVM Address Bits: | 64 |
| Boot Firmware Version: | I42 v2.00 (02/02/2019) |
| Management Firmware Version: | 1.40 Feb 05 2019 |
| Workload Version: | SSJ 1.2.10 |
| Director Location: | Controller |
| Other Software: | HPE Service Pack for ProLiant (SPP) - Version 2019.03.0 (Mar 2019) |
| JVM Instance | ssj_ops@100% |
|---|---|
| SY480-06.001 | 1,468,457 |
| SY480-06.002 | 1,488,075 |
| SY480-06.003 | 1,464,091 |
| SY480-06.004 | 1,482,528 |
| ssj_ops@100% | 5,903,152 |
| ssj_ops@100% per JVM | 1,475,788 |

| Target Load | Actual Load | ssj_ops | |
|---|---|---|---|
| Target | Actual | ||
| Calibration 1 | 1,474,858 | ||
| Calibration 2 | 1,472,991 | ||
| Calibration 3 | 1,471,859 | ||
| ssj_ops@calibrated=1,472,425 | |||
| 100% | 99.7% | 1,472,425 | 1,468,457 |
| 90% | 90.3% | 1,325,182 | 1,328,927 |
| 80% | 80.0% | 1,177,940 | 1,177,856 |
| 70% | 70.2% | 1,030,697 | 1,033,296 |
| 60% | 60.0% | 883,455 | 883,716 |
| 50% | 50.3% | 736,212 | 740,847 |
| 40% | 40.1% | 588,970 | 590,698 |
| 30% | 29.9% | 441,727 | 439,590 |
| 20% | 19.9% | 294,485 | 293,363 |
| 10% | 10.0% | 147,242 | 146,823 |
| Active Idle | 0 | 0 | |

| Target Load | Actual Load | ssj_ops | |
|---|---|---|---|
| Target | Actual | ||
| Calibration 1 | 1,494,499 | ||
| Calibration 2 | 1,488,975 | ||
| Calibration 3 | 1,492,497 | ||
| ssj_ops@calibrated=1,490,736 | |||
| 100% | 99.8% | 1,490,736 | 1,488,075 |
| 90% | 89.9% | 1,341,662 | 1,339,957 |
| 80% | 79.9% | 1,192,589 | 1,190,867 |
| 70% | 70.1% | 1,043,515 | 1,045,112 |
| 60% | 60.0% | 894,442 | 894,753 |
| 50% | 49.9% | 745,368 | 744,467 |
| 40% | 40.0% | 596,294 | 596,565 |
| 30% | 30.0% | 447,221 | 447,728 |
| 20% | 19.8% | 298,147 | 295,746 |
| 10% | 10.1% | 149,074 | 150,560 |
| Active Idle | 0 | 0 | |

| Target Load | Actual Load | ssj_ops | |
|---|---|---|---|
| Target | Actual | ||
| Calibration 1 | 1,471,290 | ||
| Calibration 2 | 1,466,148 | ||
| Calibration 3 | 1,467,880 | ||
| ssj_ops@calibrated=1,467,014 | |||
| 100% | 99.8% | 1,467,014 | 1,464,091 |
| 90% | 89.9% | 1,320,313 | 1,319,368 |
| 80% | 79.8% | 1,173,611 | 1,170,681 |
| 70% | 70.0% | 1,026,910 | 1,026,402 |
| 60% | 60.1% | 880,208 | 881,005 |
| 50% | 50.0% | 733,507 | 733,752 |
| 40% | 39.9% | 586,806 | 585,596 |
| 30% | 30.0% | 440,104 | 440,429 |
| 20% | 19.9% | 293,403 | 292,528 |
| 10% | 10.0% | 146,701 | 147,084 |
| Active Idle | 0 | 0 | |

| Target Load | Actual Load | ssj_ops | |
|---|---|---|---|
| Target | Actual | ||
| Calibration 1 | 1,486,562 | ||
| Calibration 2 | 1,484,230 | ||
| Calibration 3 | 1,488,123 | ||
| ssj_ops@calibrated=1,486,177 | |||
| 100% | 99.8% | 1,486,177 | 1,482,528 |
| 90% | 90.1% | 1,337,559 | 1,338,865 |
| 80% | 79.8% | 1,188,941 | 1,186,215 |
| 70% | 70.0% | 1,040,324 | 1,040,804 |
| 60% | 60.0% | 891,706 | 890,982 |
| 50% | 49.9% | 743,088 | 742,142 |
| 40% | 40.0% | 594,471 | 594,032 |
| 30% | 30.1% | 445,853 | 446,976 |
| 20% | 19.9% | 297,235 | 296,406 |
| 10% | 10.0% | 148,618 | 149,050 |
| Active Idle | 0 | 0 | |
