SPECpower_ssj2008
Host 'ML350' Performance Report
Copyright © 2007-2019 Standard Performance Evaluation Corporation
| Hewlett Packard Enterprise ProLiant ML350 Gen10 | ssj_ops@100% = 5,937,591 ssj_ops@100% per JVM = 1,484,398 |
||||
| Test Sponsor: | Hewlett Packard Enterprise | SPEC License #: | 3 | Test Method: | Single Node |
| Tested By: | Hewlett Packard Enterprise | Test Location: | Houston, TX, USA | Test Date: | Mar 11, 2019 |
| Hardware Availability: | Apr-2019 | Software Availability: | Mar-2018 | Publication: | Apr 2, 2019 |
| System Source: | Single Supplier | System Designation: | Server | Power Provisioning: | Line-powered |
| Target Load | Actual Load | ssj_ops | |
|---|---|---|---|
| Target | Actual | ||
| Calibration 1 | 5,966,092 | ||
| Calibration 2 | 5,959,869 | ||
| Calibration 3 | 5,956,101 | ||
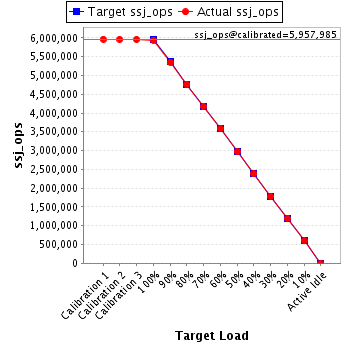
| ssj_ops@calibrated=5,957,985 | |||
| 100% | 99.7% | 5,957,985 | 5,937,591 |
| 90% | 89.8% | 5,362,187 | 5,351,933 |
| 80% | 80.0% | 4,766,388 | 4,768,287 |
| 70% | 70.0% | 4,170,590 | 4,170,981 |
| 60% | 60.1% | 3,574,791 | 3,581,021 |
| 50% | 50.0% | 2,978,993 | 2,976,897 |
| 40% | 40.0% | 2,383,194 | 2,383,796 |
| 30% | 29.9% | 1,787,396 | 1,783,847 |
| 20% | 20.0% | 1,191,597 | 1,191,308 |
| 10% | 10.0% | 595,799 | 596,719 |
| Active Idle | 0 | 0 | |
| Set Identifier: | SUT |
| Set Description: | System Under Test |
| # of Identical Nodes: | 1 |
| Comment: | SUT |
| Hardware | |
|---|---|
| Hardware Vendor: | Hewlett Packard Enterprise |
| Model: | ProLiant ML350 Gen10 |
| Form Factor: | Tower |
| CPU Name: | Intel Xeon Platinum 8280 @ 2.70GHz |
| CPU Characteristics: | 28-Core, 2.70 GHz, 38.5MB L3 Cache |
| CPU Frequency (MHz): | 2700 |
| CPU(s) Enabled: | 56 cores, 2 chips, 28 cores/chip |
| Hardware Threads: | 112 (2 / core) |
| CPU(s) Orderable: | 1,2 chips |
| Primary Cache: | 32 KB I + 32 KB D on chip per core |
| Secondary Cache: | 1 MB I+D on chip per core |
| Tertiary Cache: | 39424 KB I+D on chip per chip |
| Other Cache: | None |
| Memory Amount (GB): | 192 |
| # and size of DIMM: | 12 x 16384 MB |
| Memory Details: | 12 x 16GB 2Rx8 PC4-2933Y-R ECC; slots 1, 3, 5, 8, 10 and 12 populated on each CPU socket |
| Power Supply Quantity and Rating (W): | 1 x 800 |
| Power Supply Details: | HPE 800W Flex Slot Titanium Hot Plug Low Halogen Power Supply Kit 96% (865438-B21) |
| Disk Drive: | 1 x HPE 240GB 6G SATA M.2 SSD (875488-B21) |
| Disk Controller: | HPE Smart Array S100i SR Gen10 |
| # and type of Network Interface Cards (NICs) Installed: | 1 x HPE Ethernet 1Gb 4-port 369i Adapter |
| NICs Enabled in Firmware / OS / Connected: | 4/4/1 |
| Network Speed (Mbit): | 1000 |
| Keyboard: | None |
| Mouse: | None |
| Monitor: | None |
| Optical Drives: | No |
| Other Hardware: | Performance Heatsinks, M.2 Universal Enablement Card Kit (878783-B21), HPE ML350 Gen10 Redundant Fan Cage Kit (874572-B21) |
| Software | |
|---|---|
| Power Management: | Enabled (see SUT Notes) |
| Operating System (OS): | SUSE Linux Enterprise Server 12 SP4 |
| OS Version: | 4.12.14-94.41-default |
| Filesystem: | XFS |
| JVM Vendor: | Oracle Corporation |
| JVM Version: | Oracle Java HotSpot(TM) 64-Bit Server VM (build 24.80-b11, mixed mode), version 1.7.0_80 |
| JVM Command-line Options: | -server -Xmn19g -Xms21g -Xmx21g -XX:SurvivorRatio=1 -XX:TargetSurvivorRatio=99 -XX:AllocatePrefetchDistance=384 -XX:AllocatePrefetchLines=4 -XX:LoopUnrollLimit=37 -XX:InitialTenuringThreshold=12 -XX:MaxTenuringThreshold=15 -XX:ParallelGCThreads=28 -XX:InlineSmallCode=3900 -XX:MaxInlineSize=270 -XX:FreqInlineSize=2500 -XX:+AggressiveOpts -XX:+UseLargePages -XX:+UseParallelOldGC |
| JVM Affinity: | numactl --cpunodebind=[0-3] --localalloc |
| JVM Instances: | 4 |
| JVM Initial Heap (MB): | 21000 |
| JVM Maximum Heap (MB): | 21000 |
| JVM Address Bits: | 64 |
| Boot Firmware Version: | U41 v2.00 (02/02/2019) |
| Management Firmware Version: | 1.40 Feb 05 2019 |
| Workload Version: | SSJ 1.2.10 |
| Director Location: | Controller |
| Other Software: | HPE Service Pack for ProLiant (SPP) - Version 2019.03.0 (Mar 2019) |
| JVM Instance | ssj_ops@100% |
|---|---|
| ML350.001 | 1,486,623 |
| ML350.002 | 1,493,775 |
| ML350.003 | 1,462,130 |
| ML350.004 | 1,495,062 |
| ssj_ops@100% | 5,937,591 |
| ssj_ops@100% per JVM | 1,484,398 |

| Target Load | Actual Load | ssj_ops | |
|---|---|---|---|
| Target | Actual | ||
| Calibration 1 | 1,490,415 | ||
| Calibration 2 | 1,496,208 | ||
| Calibration 3 | 1,490,617 | ||
| ssj_ops@calibrated=1,493,413 | |||
| 100% | 99.5% | 1,493,413 | 1,486,623 |
| 90% | 90.0% | 1,344,071 | 1,343,684 |
| 80% | 80.0% | 1,194,730 | 1,195,123 |
| 70% | 69.8% | 1,045,389 | 1,042,240 |
| 60% | 60.0% | 896,048 | 895,665 |
| 50% | 50.1% | 746,706 | 748,837 |
| 40% | 40.0% | 597,365 | 597,211 |
| 30% | 29.9% | 448,024 | 446,715 |
| 20% | 20.1% | 298,683 | 300,475 |
| 10% | 10.1% | 149,341 | 150,441 |
| Active Idle | 0 | 0 | |

| Target Load | Actual Load | ssj_ops | |
|---|---|---|---|
| Target | Actual | ||
| Calibration 1 | 1,502,620 | ||
| Calibration 2 | 1,497,314 | ||
| Calibration 3 | 1,499,305 | ||
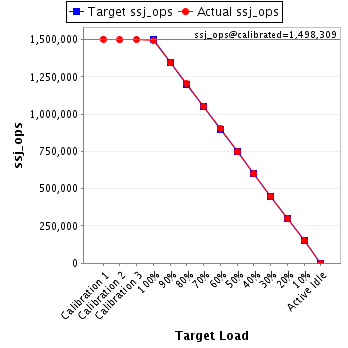
| ssj_ops@calibrated=1,498,309 | |||
| 100% | 99.7% | 1,498,309 | 1,493,775 |
| 90% | 89.7% | 1,348,478 | 1,344,727 |
| 80% | 80.2% | 1,198,647 | 1,202,300 |
| 70% | 70.2% | 1,048,817 | 1,051,541 |
| 60% | 60.2% | 898,986 | 902,407 |
| 50% | 49.8% | 749,155 | 746,219 |
| 40% | 40.1% | 599,324 | 600,581 |
| 30% | 30.0% | 449,493 | 449,157 |
| 20% | 20.0% | 299,662 | 300,298 |
| 10% | 10.0% | 149,831 | 149,710 |
| Active Idle | 0 | 0 | |
| Target Load | Actual Load | ssj_ops | |
|---|---|---|---|
| Target | Actual | ||
| Calibration 1 | 1,470,172 | ||
| Calibration 2 | 1,467,532 | ||
| Calibration 3 | 1,466,201 | ||
| ssj_ops@calibrated=1,466,867 | |||
| 100% | 99.7% | 1,466,867 | 1,462,130 |
| 90% | 89.7% | 1,320,180 | 1,315,863 |
| 80% | 79.8% | 1,173,493 | 1,170,639 |
| 70% | 70.0% | 1,026,807 | 1,027,408 |
| 60% | 60.2% | 880,120 | 883,040 |
| 50% | 50.1% | 733,433 | 734,620 |
| 40% | 40.0% | 586,747 | 586,590 |
| 30% | 29.9% | 440,060 | 438,681 |
| 20% | 19.9% | 293,373 | 292,188 |
| 10% | 10.0% | 146,687 | 146,375 |
| Active Idle | 0 | 0 | |

| Target Load | Actual Load | ssj_ops | |
|---|---|---|---|
| Target | Actual | ||
| Calibration 1 | 1,502,886 | ||
| Calibration 2 | 1,498,815 | ||
| Calibration 3 | 1,499,978 | ||
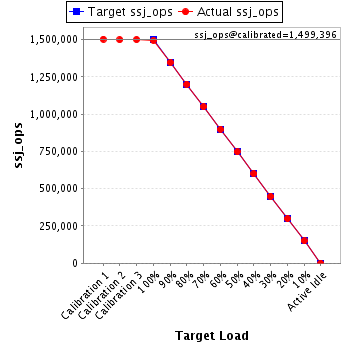
| ssj_ops@calibrated=1,499,396 | |||
| 100% | 99.7% | 1,499,396 | 1,495,062 |
| 90% | 89.9% | 1,349,457 | 1,347,659 |
| 80% | 80.0% | 1,199,517 | 1,200,226 |
| 70% | 70.0% | 1,049,577 | 1,049,792 |
| 60% | 60.0% | 899,638 | 899,909 |
| 50% | 49.8% | 749,698 | 747,221 |
| 40% | 40.0% | 599,759 | 599,414 |
| 30% | 30.0% | 449,819 | 449,294 |
| 20% | 19.9% | 299,879 | 298,347 |
| 10% | 10.0% | 149,940 | 150,194 |
| Active Idle | 0 | 0 | |