SPECpower_ssj2008
Aggregate Performance Report
Copyright © 2007-2018 Standard Performance Evaluation Corporation
| Hewlett Packard Enterprise Synergy 480 Gen10 Compute Module | ssj_ops@100% = 28,585,334 ssj_ops@100% per Host = 5,717,067 ssj_ops@100% per JVM = 1,429,267 |
||||
| Test Sponsor: | Hewlett Packard Enterprise | SPEC License #: | 3 | Test Method: | Multi Node |
| Tested By: | Hewlett Packard Enterprise | Test Location: | Houston, TX, USA | Test Date: | Aug 29, 2018 |
| Hardware Availability: | Jun-2018 | Software Availability: | Mar-2018 | Publication: | Sep 12, 2018 |
| System Source: | Single Supplier | System Designation: | Server | Power Provisioning: | Line-powered |
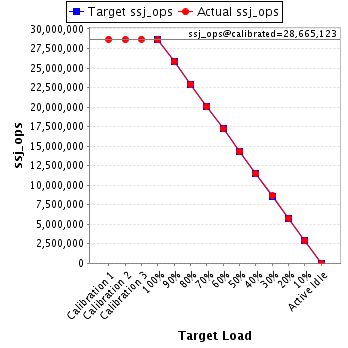
| Target Load | Actual Load | ssj_ops | |
|---|---|---|---|
| Target | Actual | ||
| Calibration 1 | 28,687,978 | ||
| Calibration 2 | 28,638,681 | ||
| Calibration 3 | 28,691,565 | ||
| ssj_ops@calibrated=28,665,123 | |||
| 100% | 99.7% | 28,665,123 | 28,585,334 |
| 90% | 90.0% | 25,798,611 | 25,812,587 |
| 80% | 80.0% | 22,932,098 | 22,927,453 |
| 70% | 70.1% | 20,065,586 | 20,083,429 |
| 60% | 60.0% | 17,199,074 | 17,191,794 |
| 50% | 50.0% | 14,332,561 | 14,337,787 |
| 40% | 40.0% | 11,466,049 | 11,468,174 |
| 30% | 30.1% | 8,599,537 | 8,614,759 |
| 20% | 20.0% | 5,733,025 | 5,730,598 |
| 10% | 10.0% | 2,866,512 | 2,864,839 |
| Active Idle | 0 | 0 | |
| # of Nodes | # of Chips | # of Cores | # of Threads | Total RAM (GB) | # of OS Images | # of JVM Instances |
|---|---|---|---|---|---|---|
| 5 | 10 | 280 | 560 | 960 | 5 | 20 |
| Set Identifier: | SUT |
| Set Description: | System Under Test |
| # of Identical Nodes: | 5 |
| Comment: | SUT |
| Hardware per Node | |
|---|---|
| Hardware Vendor: | Hewlett Packard Enterprise |
| Model: | Synergy 480 Gen10 Compute Module |
| Form Factor: | Other |
| CPU Name: | Intel Xeon Platinum 8180 2.50GHz |
| CPU Characteristics: | 28-Core, 2.50 GHz, 38.5 MB L3 Cache |
| CPU Frequency (MHz): | 2500 |
| CPU(s) Enabled: | 56 cores, 2 chips, 28 cores/chip |
| Hardware Threads: | 112 (2 / core) |
| CPU(s) Orderable: | 1,2 chips |
| Primary Cache: | 32 KB I + 32 KB D on chip per core |
| Secondary Cache: | 1 MB I+D on chip per core |
| Tertiary Cache: | 39424 KB I+D on chip per chip |
| Other Cache: | None |
| Memory Amount (GB): | 192 |
| # and size of DIMM: | 12 x 16384 MB |
| Memory Details: | 12 x 16GB 2Rx8 PC4-2666-V ECC; slots 1, 3, 5, 8, 10 and 12 populated on each CPU socket |
| Power Supply Quantity and Rating (W): | None |
| Power Supply Details: | Shared |
| Disk Drive: | 1 x HPE Synergy 480 Gen10 M.2 FIO Adapter Board Kit (873165-B21); 1 x HPE 480GB SATA 6G Read Intensive M.2 2280 SSD (875498-B21) |
| Disk Controller: | 1 x HPE Smart Array S100i SR Gen10 |
| # and type of Network Interface Cards (NICs) Installed: | 1 x HPE Synergy 3820C 10/20Gb 2-port Converged Network Adapter (777430-B21) |
| NICs Enabled in Firmware / OS / Connected: | 2/1/1 |
| Network Speed (Mbit): | 10000 |
| Keyboard: | None |
| Mouse: | None |
| Monitor: | None |
| Optical Drives: | No |
| Other Hardware: | None |
| Software per Node | |
|---|---|
| Power Management: | Enabled (see SUT Notes) |
| Operating System (OS): | Windows Server 2012 R2 Datacenter |
| OS Version: | 6.3 (Build 9600) |
| Filesystem: | NTFS |
| JVM Vendor: | Oracle Corporation |
| JVM Version: | Java HotSpot(TM) 64-Bit Server VM (build 24.80-b11, mixed mode), version 1.7.0_80 |
| JVM Command-line Options: | -server -Xmn19g -Xms21g -Xmx21g -XX:SurvivorRatio=1 -XX:TargetSurvivorRatio=99 -XX:ParallelGCThreads=28 -XX:AllocatePrefetchDistance=256 -XX:AllocatePrefetchLines=4 -XX:LoopUnrollLimit=45 -XX:InitialTenuringThreshold=12 -XX:MaxTenuringThreshold=15 -XX:InlineSmallCode=9000 -XX:MaxInlineSize=270 -XX:FreqInlineSize=6000 -XX:+UseLargePages -XX:+UseParallelOldGC -XX:+AggressiveOpts |
| JVM Affinity: | start /NODE [0,1,2,3] /AFFINITY [0xFFFFFFF] |
| JVM Instances: | 4 |
| JVM Initial Heap (MB): | 21000 |
| JVM Maximum Heap (MB): | 21000 |
| JVM Address Bits: | 64 |
| Boot Firmware Version: | I42 v1.32 (02/01/2018) |
| Management Firmware Version: | 1.15 Aug 17 2017 |
| Workload Version: | SSJ 1.2.10 |
| Director Location: | Controller |
| Other Software: | HPE Composer Version 3.10.07 (HPE OneView) with HPE Synergy Custom SPP Bundle 2017.10.20180323; Microsoft Windows KB4054519, KB4056898 |
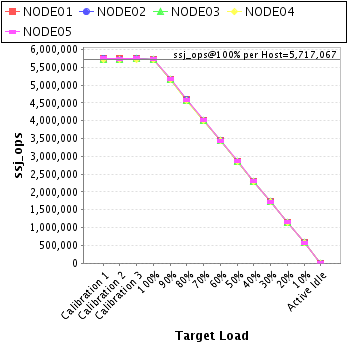
| Host | ssj_ops@100% |
|---|---|
| NODE01 | 5,725,541 |
| NODE02 | 5,718,092 |
| NODE03 | 5,708,355 |
| NODE04 | 5,705,596 |
| NODE05 | 5,727,750 |
| ssj_ops@100% | 28,585,334 |
| ssj_ops@100% per Host | 5,717,067 |
| ssj_ops@100% per JVM | 1,429,267 |
| Target Load | Actual Load | ssj_ops | |
|---|---|---|---|
| Target | Actual | ||
| Calibration 1 | 5,743,856 | ||
| Calibration 2 | 5,734,751 | ||
| Calibration 3 | 5,735,286 | ||
| ssj_ops@calibrated=5,735,018 | |||
| 100% | 99.8% | 5,735,018 | 5,725,541 |
| 90% | 90.2% | 5,161,517 | 5,170,584 |
| 80% | 80.1% | 4,588,015 | 4,595,713 |
| 70% | 70.1% | 4,014,513 | 4,020,182 |
| 60% | 60.0% | 3,441,011 | 3,440,030 |
| 50% | 50.0% | 2,867,509 | 2,868,712 |
| 40% | 40.1% | 2,294,007 | 2,297,396 |
| 30% | 30.1% | 1,720,506 | 1,725,932 |
| 20% | 20.0% | 1,147,004 | 1,146,653 |
| 10% | 10.0% | 573,502 | 574,367 |
| Active Idle | 0 | 0 | |
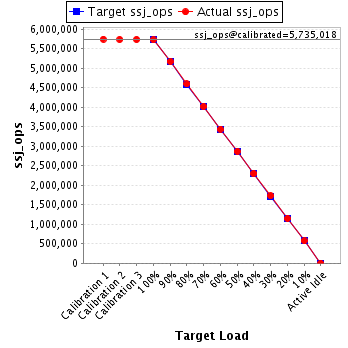
| Target Load | Actual Load | ssj_ops | |
|---|---|---|---|
| Target | Actual | ||
| Calibration 1 | 5,735,840 | ||
| Calibration 2 | 5,730,693 | ||
| Calibration 3 | 5,739,278 | ||
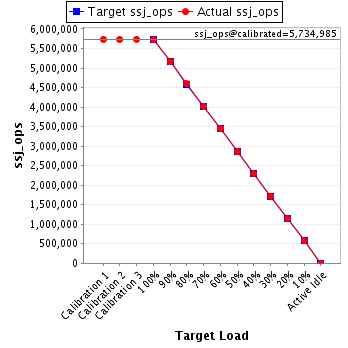
| ssj_ops@calibrated=5,734,985 | |||
| 100% | 99.7% | 5,734,985 | 5,718,092 |
| 90% | 90.0% | 5,161,487 | 5,161,005 |
| 80% | 80.1% | 4,587,988 | 4,591,810 |
| 70% | 70.0% | 4,014,490 | 4,015,339 |
| 60% | 60.0% | 3,440,991 | 3,443,159 |
| 50% | 50.0% | 2,867,493 | 2,865,104 |
| 40% | 39.9% | 2,293,994 | 2,289,620 |
| 30% | 30.0% | 1,720,496 | 1,720,823 |
| 20% | 20.0% | 1,146,997 | 1,146,396 |
| 10% | 10.0% | 573,499 | 574,259 |
| Active Idle | 0 | 0 | |
| Target Load | Actual Load | ssj_ops | |
|---|---|---|---|
| Target | Actual | ||
| Calibration 1 | 5,731,556 | ||
| Calibration 2 | 5,718,155 | ||
| Calibration 3 | 5,734,740 | ||
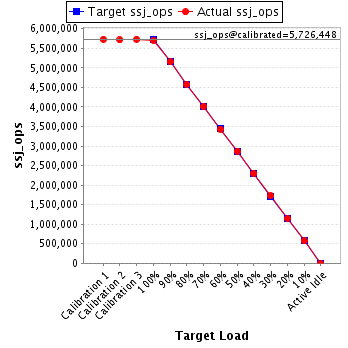
| ssj_ops@calibrated=5,726,448 | |||
| 100% | 99.7% | 5,726,448 | 5,708,355 |
| 90% | 90.0% | 5,153,803 | 5,153,387 |
| 80% | 79.9% | 4,581,158 | 4,576,368 |
| 70% | 70.0% | 4,008,513 | 4,010,864 |
| 60% | 60.0% | 3,435,869 | 3,435,544 |
| 50% | 50.1% | 2,863,224 | 2,868,267 |
| 40% | 40.0% | 2,290,579 | 2,292,345 |
| 30% | 30.1% | 1,717,934 | 1,721,570 |
| 20% | 20.0% | 1,145,290 | 1,144,335 |
| 10% | 10.0% | 572,645 | 571,685 |
| Active Idle | 0 | 0 | |
| Target Load | Actual Load | ssj_ops | |
|---|---|---|---|
| Target | Actual | ||
| Calibration 1 | 5,721,114 | ||
| Calibration 2 | 5,714,984 | ||
| Calibration 3 | 5,728,577 | ||
| ssj_ops@calibrated=5,721,780 | |||
| 100% | 99.7% | 5,721,780 | 5,705,596 |
| 90% | 90.1% | 5,149,602 | 5,153,934 |
| 80% | 80.0% | 4,577,424 | 4,575,806 |
| 70% | 70.0% | 4,005,246 | 4,006,509 |
| 60% | 60.0% | 3,433,068 | 3,433,313 |
| 50% | 50.0% | 2,860,890 | 2,862,595 |
| 40% | 40.0% | 2,288,712 | 2,289,275 |
| 30% | 30.1% | 1,716,534 | 1,719,873 |
| 20% | 20.0% | 1,144,356 | 1,145,192 |
| 10% | 10.0% | 572,178 | 571,086 |
| Active Idle | 0 | 0 | |

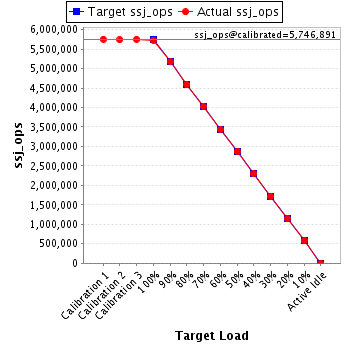
| Target Load | Actual Load | ssj_ops | |
|---|---|---|---|
| Target | Actual | ||
| Calibration 1 | 5,755,611 | ||
| Calibration 2 | 5,740,099 | ||
| Calibration 3 | 5,753,683 | ||
| ssj_ops@calibrated=5,746,891 | |||
| 100% | 99.7% | 5,746,891 | 5,727,750 |
| 90% | 90.0% | 5,172,202 | 5,173,677 |
| 80% | 79.8% | 4,597,513 | 4,587,757 |
| 70% | 70.1% | 4,022,824 | 4,030,536 |
| 60% | 59.9% | 3,448,135 | 3,439,749 |
| 50% | 50.0% | 2,873,446 | 2,873,109 |
| 40% | 40.0% | 2,298,756 | 2,299,538 |
| 30% | 30.0% | 1,724,067 | 1,726,561 |
| 20% | 20.0% | 1,149,378 | 1,148,023 |
| 10% | 10.0% | 574,689 | 573,441 |
| Active Idle | 0 | 0 | |