SPECpower_ssj2008
Host 'Node05' Performance Report
Copyright © 2007-2018 Standard Performance Evaluation Corporation
| Hewlett Packard Enterprise Synergy 660 Gen10 Compute Module | ssj_ops@100% = 11,499,199 ssj_ops@100% per JVM = 1,437,400 |
||||
| Test Sponsor: | Hewlett Packard Enterprise | SPEC License #: | 3 | Test Method: | Multi Node |
| Tested By: | Hewlett Packard Enterprise | Test Location: | Houston, TX, USA | Test Date: | Aug 27, 2018 |
| Hardware Availability: | Jun-2018 | Software Availability: | Mar-2018 | Publication: | Sep 12, 2018 |
| System Source: | Single Supplier | System Designation: | Server | Power Provisioning: | Line-powered |
| Target Load | Actual Load | ssj_ops | |
|---|---|---|---|
| Target | Actual | ||
| Calibration 1 | 11,526,432 | ||
| Calibration 2 | 11,518,288 | ||
| Calibration 3 | 11,532,221 | ||
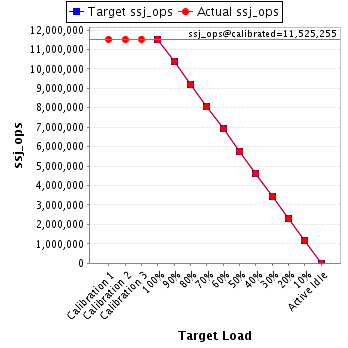
| ssj_ops@calibrated=11,525,255 | |||
| 100% | 99.8% | 11,525,255 | 11,499,199 |
| 90% | 90.0% | 10,372,729 | 10,371,024 |
| 80% | 79.9% | 9,220,204 | 9,205,443 |
| 70% | 70.1% | 8,067,678 | 8,073,933 |
| 60% | 60.0% | 6,915,153 | 6,915,239 |
| 50% | 50.0% | 5,762,627 | 5,767,129 |
| 40% | 40.0% | 4,610,102 | 4,608,074 |
| 30% | 30.0% | 3,457,576 | 3,453,454 |
| 20% | 20.0% | 2,305,051 | 2,306,968 |
| 10% | 10.0% | 1,152,525 | 1,153,513 |
| Active Idle | 0 | 0 | |
| Set Identifier: | SUT |
| Set Description: | System Under Test |
| # of Identical Nodes: | 5 |
| Comment: | SUT |
| Hardware | |
|---|---|
| Hardware Vendor: | Hewlett Packard Enterprise |
| Model: | Synergy 660 Gen10 Compute Module |
| Form Factor: | Other |
| CPU Name: | Intel Xeon Platinum 8180 2.50GHz |
| CPU Characteristics: | 28-Core, 2.50 GHz, 38.5MB L3 Cache |
| CPU Frequency (MHz): | 2500 |
| CPU(s) Enabled: | 112 cores, 4 chips, 28 cores/chip |
| Hardware Threads: | 224 (2 / core) |
| CPU(s) Orderable: | 1,2,3,4 chips |
| Primary Cache: | 32 KB I + 32 KB D on chip per core |
| Secondary Cache: | 1 MB I+D on chip per core |
| Tertiary Cache: | 39424 KB I+D on chip per chip |
| Other Cache: | None |
| Memory Amount (GB): | 384 |
| # and size of DIMM: | 24 x 16384 MB |
| Memory Details: | 24 x 16GB 2Rx8 PC4-2666-V ECC; slots 1, 3, 5, 8, 10 and 12 populated on each CPU socket |
| Power Supply Quantity and Rating (W): | None |
| Power Supply Details: | Shared |
| Disk Drive: | 1 x HPE 480GB SATA 6G Read Intensive M.2 (875319-B21) |
| Disk Controller: | 1 x HPE Smart Array S100i SR Gen10 (784308-B21) |
| # and type of Network Interface Cards (NICs) Installed: | 1 x HPE Synergy 3820C 10/20Gb 2-port Converged Network Adapter (777430-B21) |
| NICs Enabled in Firmware / OS / Connected: | 2/1/1 |
| Network Speed (Mbit): | 10000 |
| Keyboard: | None |
| Mouse: | None |
| Monitor: | None |
| Optical Drives: | No |
| Other Hardware: | None |
| Software | |
|---|---|
| Power Management: | Enabled (see SUT Notes) |
| Operating System (OS): | Windows Server 2012 R2 Datacenter |
| OS Version: | Version 6.3 (Build 9600) |
| Filesystem: | NTFS |
| JVM Vendor: | Oracle Corporation |
| JVM Version: | Oracle Java HotSpot(TM) 64-Bit Server VM (build 24.80-b11, mixed mode), version 1.7.0_80 |
| JVM Command-line Options: | -server -Xmn19g -Xms21g -Xmx21g -XX:SurvivorRatio=1 -XX:TargetSurvivorRatio=99 -XX:AllocatePrefetchDistance=256 -XX:AllocatePrefetchLines=4 -XX:LoopUnrollLimit=30 -XX:InitialTenuringThreshold=12 -XX:MaxTenuringThreshold=15 -XX:ParallelGCThreads=28 -XX:InlineSmallCode=3900 -XX:MaxInlineSize=270 -XX:FreqInlineSize=2500 -XX:+AggressiveOpts -XX:+UseLargePages -XX:+UseParallelOldGC |
| JVM Affinity: | start /NODE [0,2,4,6] /AFFINITY [0x0000000FC0FF, 0xFC0FF0000000]; start /NODE [1,3,5,7] /AFFINITY [0x0000000FF03F,0xFF03F0000000] |
| JVM Instances: | 8 |
| JVM Initial Heap (MB): | 21000 |
| JVM Maximum Heap (MB): | 21000 |
| JVM Address Bits: | 64 |
| Boot Firmware Version: | I43 v1.32 (02/01/2018) |
| Management Firmware Version: | 1.15 August 17 2017 |
| Workload Version: | SSJ 1.2.10 |
| Director Location: | Controller |
| Other Software: | HPE Composer Version 3.10.07 (HPE OneView) with HPE Synergy Custom SPP Bundle 2017.10.20180323; Microsoft Windows KB4054519, KB4056898 |
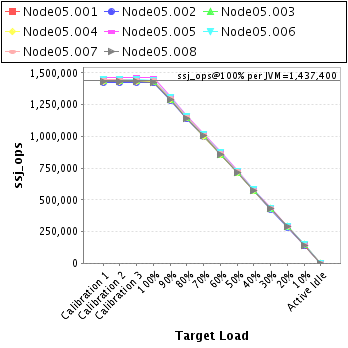
| JVM Instance | ssj_ops@100% |
|---|---|
| Node05.001 | 1,435,946 |
| Node05.002 | 1,422,372 |
| Node05.003 | 1,434,415 |
| Node05.004 | 1,429,100 |
| Node05.005 | 1,462,968 |
| Node05.006 | 1,443,945 |
| Node05.007 | 1,441,983 |
| Node05.008 | 1,428,471 |
| ssj_ops@100% | 11,499,199 |
| ssj_ops@100% per JVM | 1,437,400 |
| Target Load | Actual Load | ssj_ops | |
|---|---|---|---|
| Target | Actual | ||
| Calibration 1 | 1,439,752 | ||
| Calibration 2 | 1,437,477 | ||
| Calibration 3 | 1,439,821 | ||
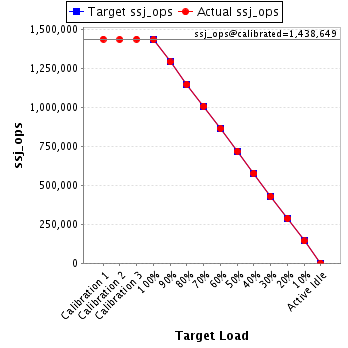
| ssj_ops@calibrated=1,438,649 | |||
| 100% | 99.8% | 1,438,649 | 1,435,946 |
| 90% | 89.9% | 1,294,784 | 1,293,487 |
| 80% | 79.8% | 1,150,919 | 1,148,720 |
| 70% | 70.2% | 1,007,054 | 1,009,902 |
| 60% | 60.1% | 863,189 | 864,659 |
| 50% | 50.0% | 719,324 | 719,310 |
| 40% | 40.1% | 575,460 | 576,434 |
| 30% | 29.9% | 431,595 | 429,926 |
| 20% | 20.0% | 287,730 | 288,259 |
| 10% | 10.0% | 143,865 | 143,398 |
| Active Idle | 0 | 0 | |
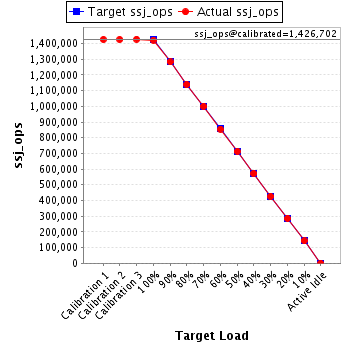
| Target Load | Actual Load | ssj_ops | |
|---|---|---|---|
| Target | Actual | ||
| Calibration 1 | 1,425,991 | ||
| Calibration 2 | 1,425,459 | ||
| Calibration 3 | 1,427,944 | ||
| ssj_ops@calibrated=1,426,702 | |||
| 100% | 99.7% | 1,426,702 | 1,422,372 |
| 90% | 89.9% | 1,284,031 | 1,282,801 |
| 80% | 79.9% | 1,141,361 | 1,139,457 |
| 70% | 70.2% | 998,691 | 1,001,490 |
| 60% | 60.0% | 856,021 | 855,396 |
| 50% | 49.9% | 713,351 | 712,603 |
| 40% | 40.1% | 570,681 | 571,509 |
| 30% | 29.9% | 428,010 | 426,468 |
| 20% | 20.0% | 285,340 | 285,699 |
| 10% | 10.0% | 142,670 | 142,963 |
| Active Idle | 0 | 0 | |
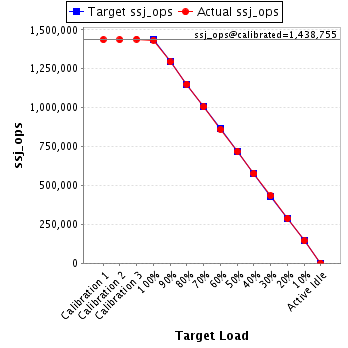
| Target Load | Actual Load | ssj_ops | |
|---|---|---|---|
| Target | Actual | ||
| Calibration 1 | 1,436,932 | ||
| Calibration 2 | 1,436,963 | ||
| Calibration 3 | 1,440,547 | ||
| ssj_ops@calibrated=1,438,755 | |||
| 100% | 99.7% | 1,438,755 | 1,434,415 |
| 90% | 90.0% | 1,294,879 | 1,294,176 |
| 80% | 80.0% | 1,151,004 | 1,150,463 |
| 70% | 69.9% | 1,007,128 | 1,005,473 |
| 60% | 59.8% | 863,253 | 860,692 |
| 50% | 49.9% | 719,377 | 718,395 |
| 40% | 40.0% | 575,502 | 575,700 |
| 30% | 30.1% | 431,626 | 432,796 |
| 20% | 20.1% | 287,751 | 288,638 |
| 10% | 10.1% | 143,875 | 144,710 |
| Active Idle | 0 | 0 | |
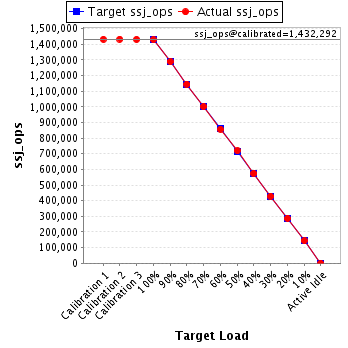
| Target Load | Actual Load | ssj_ops | |
|---|---|---|---|
| Target | Actual | ||
| Calibration 1 | 1,432,372 | ||
| Calibration 2 | 1,432,778 | ||
| Calibration 3 | 1,431,806 | ||
| ssj_ops@calibrated=1,432,292 | |||
| 100% | 99.8% | 1,432,292 | 1,429,100 |
| 90% | 90.0% | 1,289,063 | 1,289,199 |
| 80% | 80.0% | 1,145,834 | 1,145,321 |
| 70% | 70.0% | 1,002,605 | 1,002,310 |
| 60% | 59.9% | 859,375 | 857,373 |
| 50% | 50.2% | 716,146 | 719,224 |
| 40% | 40.1% | 572,917 | 573,702 |
| 30% | 30.0% | 429,688 | 429,527 |
| 20% | 20.1% | 286,458 | 287,902 |
| 10% | 10.1% | 143,229 | 144,053 |
| Active Idle | 0 | 0 | |
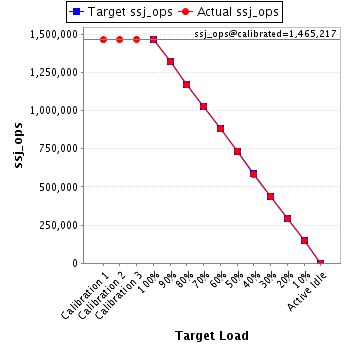
| Target Load | Actual Load | ssj_ops | |
|---|---|---|---|
| Target | Actual | ||
| Calibration 1 | 1,461,768 | ||
| Calibration 2 | 1,463,592 | ||
| Calibration 3 | 1,466,841 | ||
| ssj_ops@calibrated=1,465,217 | |||
| 100% | 99.8% | 1,465,217 | 1,462,968 |
| 90% | 90.0% | 1,318,695 | 1,318,230 |
| 80% | 79.6% | 1,172,173 | 1,166,952 |
| 70% | 69.9% | 1,025,652 | 1,024,391 |
| 60% | 60.0% | 879,130 | 879,597 |
| 50% | 50.1% | 732,608 | 734,451 |
| 40% | 39.9% | 586,087 | 584,050 |
| 30% | 29.9% | 439,565 | 438,558 |
| 20% | 19.9% | 293,043 | 291,580 |
| 10% | 10.0% | 146,522 | 147,068 |
| Active Idle | 0 | 0 | |
| Target Load | Actual Load | ssj_ops | |
|---|---|---|---|
| Target | Actual | ||
| Calibration 1 | 1,450,200 | ||
| Calibration 2 | 1,446,691 | ||
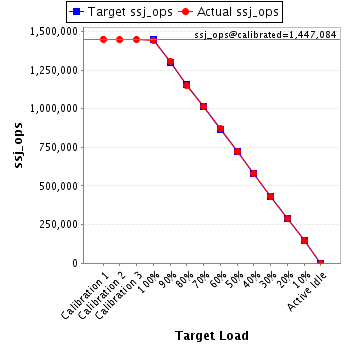
| Calibration 3 | 1,447,477 | ||
| ssj_ops@calibrated=1,447,084 | |||
| 100% | 99.8% | 1,447,084 | 1,443,945 |
| 90% | 90.1% | 1,302,375 | 1,304,163 |
| 80% | 79.7% | 1,157,667 | 1,153,104 |
| 70% | 70.1% | 1,012,959 | 1,013,753 |
| 60% | 60.2% | 868,250 | 871,349 |
| 50% | 50.0% | 723,542 | 723,759 |
| 40% | 40.0% | 578,834 | 578,962 |
| 30% | 29.9% | 434,125 | 432,464 |
| 20% | 19.9% | 289,417 | 288,468 |
| 10% | 10.0% | 144,708 | 144,478 |
| Active Idle | 0 | 0 | |
| Target Load | Actual Load | ssj_ops | |
|---|---|---|---|
| Target | Actual | ||
| Calibration 1 | 1,448,257 | ||
| Calibration 2 | 1,446,135 | ||
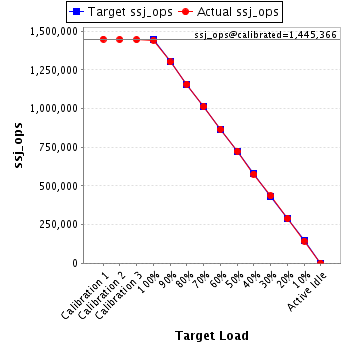
| Calibration 3 | 1,444,597 | ||
| ssj_ops@calibrated=1,445,366 | |||
| 100% | 99.8% | 1,445,366 | 1,441,983 |
| 90% | 90.0% | 1,300,829 | 1,301,046 |
| 80% | 80.0% | 1,156,293 | 1,156,871 |
| 70% | 70.1% | 1,011,756 | 1,013,094 |
| 60% | 59.9% | 867,220 | 866,149 |
| 50% | 50.1% | 722,683 | 723,613 |
| 40% | 39.9% | 578,146 | 576,487 |
| 30% | 30.1% | 433,610 | 434,750 |
| 20% | 20.0% | 289,073 | 288,924 |
| 10% | 9.9% | 144,537 | 143,811 |
| Active Idle | 0 | 0 | |
| Target Load | Actual Load | ssj_ops | |
|---|---|---|---|
| Target | Actual | ||
| Calibration 1 | 1,431,160 | ||
| Calibration 2 | 1,429,194 | ||
| Calibration 3 | 1,433,187 | ||
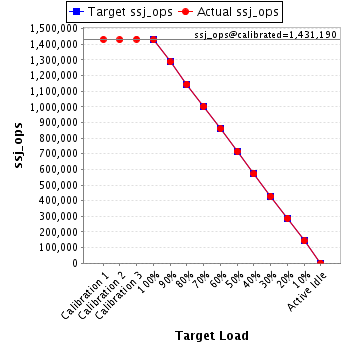
| ssj_ops@calibrated=1,431,190 | |||
| 100% | 99.8% | 1,431,190 | 1,428,471 |
| 90% | 90.0% | 1,288,071 | 1,287,922 |
| 80% | 80.0% | 1,144,952 | 1,144,556 |
| 70% | 70.1% | 1,001,833 | 1,003,521 |
| 60% | 60.1% | 858,714 | 860,024 |
| 50% | 50.0% | 715,595 | 715,774 |
| 40% | 39.9% | 572,476 | 571,231 |
| 30% | 30.0% | 429,357 | 428,964 |
| 20% | 20.1% | 286,238 | 287,498 |
| 10% | 10.0% | 143,119 | 143,031 |
| Active Idle | 0 | 0 | |