SPECpower_ssj2008
Host 'Node03' Performance Report
Copyright © 2007-2018 Standard Performance Evaluation Corporation
| Hewlett Packard Enterprise Synergy 660 Gen10 Compute Module | ssj_ops@100% = 11,553,149 ssj_ops@100% per JVM = 1,444,144 |
||||
| Test Sponsor: | Hewlett Packard Enterprise | SPEC License #: | 3 | Test Method: | Multi Node |
| Tested By: | Hewlett Packard Enterprise | Test Location: | Houston, TX, USA | Test Date: | Aug 27, 2018 |
| Hardware Availability: | Jun-2018 | Software Availability: | Mar-2018 | Publication: | Sep 12, 2018 |
| System Source: | Single Supplier | System Designation: | Server | Power Provisioning: | Line-powered |
| Target Load | Actual Load | ssj_ops | |
|---|---|---|---|
| Target | Actual | ||
| Calibration 1 | 11,576,021 | ||
| Calibration 2 | 11,565,890 | ||
| Calibration 3 | 11,588,582 | ||
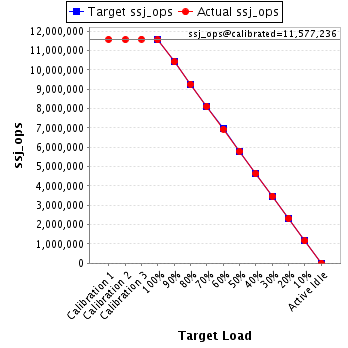
| ssj_ops@calibrated=11,577,236 | |||
| 100% | 99.8% | 11,577,236 | 11,553,149 |
| 90% | 90.0% | 10,419,512 | 10,421,703 |
| 80% | 80.0% | 9,261,789 | 9,262,791 |
| 70% | 70.0% | 8,104,065 | 8,106,926 |
| 60% | 59.9% | 6,946,341 | 6,938,901 |
| 50% | 50.1% | 5,788,618 | 5,796,487 |
| 40% | 40.0% | 4,630,894 | 4,626,683 |
| 30% | 30.0% | 3,473,171 | 3,473,488 |
| 20% | 20.0% | 2,315,447 | 2,319,006 |
| 10% | 10.0% | 1,157,724 | 1,158,605 |
| Active Idle | 0 | 0 | |
| Set Identifier: | SUT |
| Set Description: | System Under Test |
| # of Identical Nodes: | 5 |
| Comment: | SUT |
| Hardware | |
|---|---|
| Hardware Vendor: | Hewlett Packard Enterprise |
| Model: | Synergy 660 Gen10 Compute Module |
| Form Factor: | Other |
| CPU Name: | Intel Xeon Platinum 8180 2.50GHz |
| CPU Characteristics: | 28-Core, 2.50 GHz, 38.5MB L3 Cache |
| CPU Frequency (MHz): | 2500 |
| CPU(s) Enabled: | 112 cores, 4 chips, 28 cores/chip |
| Hardware Threads: | 224 (2 / core) |
| CPU(s) Orderable: | 1,2,3,4 chips |
| Primary Cache: | 32 KB I + 32 KB D on chip per core |
| Secondary Cache: | 1 MB I+D on chip per core |
| Tertiary Cache: | 39424 KB I+D on chip per chip |
| Other Cache: | None |
| Memory Amount (GB): | 384 |
| # and size of DIMM: | 24 x 16384 MB |
| Memory Details: | 24 x 16GB 2Rx8 PC4-2666-V ECC; slots 1, 3, 5, 8, 10 and 12 populated on each CPU socket |
| Power Supply Quantity and Rating (W): | None |
| Power Supply Details: | Shared |
| Disk Drive: | 1 x HPE 480GB SATA 6G Read Intensive M.2 (875319-B21) |
| Disk Controller: | 1 x HPE Smart Array S100i SR Gen10 (784308-B21) |
| # and type of Network Interface Cards (NICs) Installed: | 1 x HPE Synergy 3820C 10/20Gb 2-port Converged Network Adapter (777430-B21) |
| NICs Enabled in Firmware / OS / Connected: | 2/1/1 |
| Network Speed (Mbit): | 10000 |
| Keyboard: | None |
| Mouse: | None |
| Monitor: | None |
| Optical Drives: | No |
| Other Hardware: | None |
| Software | |
|---|---|
| Power Management: | Enabled (see SUT Notes) |
| Operating System (OS): | Windows Server 2012 R2 Datacenter |
| OS Version: | Version 6.3 (Build 9600) |
| Filesystem: | NTFS |
| JVM Vendor: | Oracle Corporation |
| JVM Version: | Oracle Java HotSpot(TM) 64-Bit Server VM (build 24.80-b11, mixed mode), version 1.7.0_80 |
| JVM Command-line Options: | -server -Xmn19g -Xms21g -Xmx21g -XX:SurvivorRatio=1 -XX:TargetSurvivorRatio=99 -XX:AllocatePrefetchDistance=256 -XX:AllocatePrefetchLines=4 -XX:LoopUnrollLimit=30 -XX:InitialTenuringThreshold=12 -XX:MaxTenuringThreshold=15 -XX:ParallelGCThreads=28 -XX:InlineSmallCode=3900 -XX:MaxInlineSize=270 -XX:FreqInlineSize=2500 -XX:+AggressiveOpts -XX:+UseLargePages -XX:+UseParallelOldGC |
| JVM Affinity: | start /NODE [0,2,4,6] /AFFINITY [0x0000000FC0FF, 0xFC0FF0000000]; start /NODE [1,3,5,7] /AFFINITY [0x0000000FF03F,0xFF03F0000000] |
| JVM Instances: | 8 |
| JVM Initial Heap (MB): | 21000 |
| JVM Maximum Heap (MB): | 21000 |
| JVM Address Bits: | 64 |
| Boot Firmware Version: | I43 v1.32 (02/01/2018) |
| Management Firmware Version: | 1.15 August 17 2017 |
| Workload Version: | SSJ 1.2.10 |
| Director Location: | Controller |
| Other Software: | HPE Composer Version 3.10.07 (HPE OneView) with HPE Synergy Custom SPP Bundle 2017.10.20180323; Microsoft Windows KB4054519, KB4056898 |
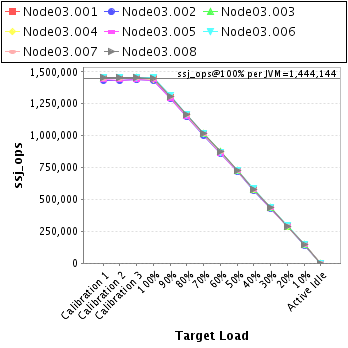
| JVM Instance | ssj_ops@100% |
|---|---|
| Node03.001 | 1,444,611 |
| Node03.002 | 1,431,156 |
| Node03.003 | 1,448,244 |
| Node03.004 | 1,443,139 |
| Node03.005 | 1,435,825 |
| Node03.006 | 1,454,240 |
| Node03.007 | 1,444,221 |
| Node03.008 | 1,451,715 |
| ssj_ops@100% | 11,553,149 |
| ssj_ops@100% per JVM | 1,444,144 |
| Target Load | Actual Load | ssj_ops | |
|---|---|---|---|
| Target | Actual | ||
| Calibration 1 | 1,446,969 | ||
| Calibration 2 | 1,444,994 | ||
| Calibration 3 | 1,448,364 | ||
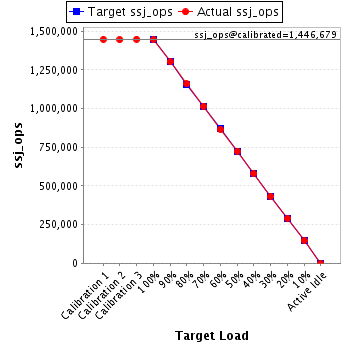
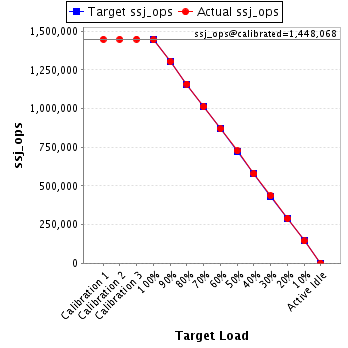
| ssj_ops@calibrated=1,446,679 | |||
| 100% | 99.9% | 1,446,679 | 1,444,611 |
| 90% | 90.0% | 1,302,011 | 1,302,477 |
| 80% | 80.2% | 1,157,343 | 1,159,536 |
| 70% | 70.2% | 1,012,675 | 1,015,792 |
| 60% | 59.9% | 868,008 | 866,028 |
| 50% | 50.1% | 723,340 | 725,111 |
| 40% | 40.0% | 578,672 | 579,285 |
| 30% | 30.0% | 434,004 | 433,487 |
| 20% | 20.1% | 289,336 | 290,580 |
| 10% | 10.1% | 144,668 | 145,987 |
| Active Idle | 0 | 0 | |
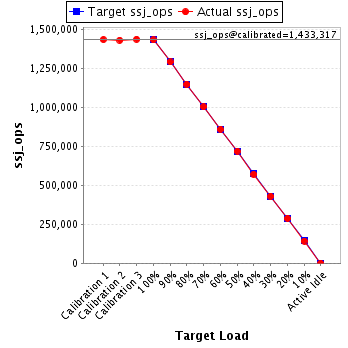
| Target Load | Actual Load | ssj_ops | |
|---|---|---|---|
| Target | Actual | ||
| Calibration 1 | 1,433,052 | ||
| Calibration 2 | 1,430,346 | ||
| Calibration 3 | 1,436,288 | ||
| ssj_ops@calibrated=1,433,317 | |||
| 100% | 99.8% | 1,433,317 | 1,431,156 |
| 90% | 90.0% | 1,289,985 | 1,290,013 |
| 80% | 80.0% | 1,146,653 | 1,147,231 |
| 70% | 69.9% | 1,003,322 | 1,002,140 |
| 60% | 60.0% | 859,990 | 859,628 |
| 50% | 50.1% | 716,658 | 718,547 |
| 40% | 39.8% | 573,327 | 570,547 |
| 30% | 30.0% | 429,995 | 430,571 |
| 20% | 20.0% | 286,663 | 287,374 |
| 10% | 9.9% | 143,332 | 142,578 |
| Active Idle | 0 | 0 | |
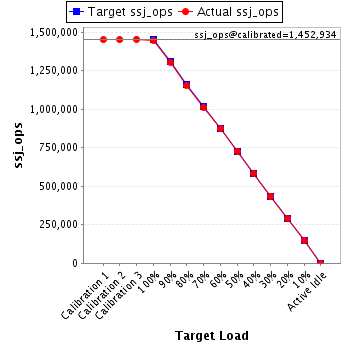
| Target Load | Actual Load | ssj_ops | |
|---|---|---|---|
| Target | Actual | ||
| Calibration 1 | 1,450,956 | ||
| Calibration 2 | 1,451,107 | ||
| Calibration 3 | 1,454,761 | ||
| ssj_ops@calibrated=1,452,934 | |||
| 100% | 99.7% | 1,452,934 | 1,448,244 |
| 90% | 89.9% | 1,307,641 | 1,306,256 |
| 80% | 79.6% | 1,162,347 | 1,156,984 |
| 70% | 69.8% | 1,017,054 | 1,014,344 |
| 60% | 60.1% | 871,761 | 873,136 |
| 50% | 50.0% | 726,467 | 725,954 |
| 40% | 40.0% | 581,174 | 581,203 |
| 30% | 30.0% | 435,880 | 435,274 |
| 20% | 19.9% | 290,587 | 289,508 |
| 10% | 10.1% | 145,293 | 146,674 |
| Active Idle | 0 | 0 | |
| Target Load | Actual Load | ssj_ops | |
|---|---|---|---|
| Target | Actual | ||
| Calibration 1 | 1,447,184 | ||
| Calibration 2 | 1,448,118 | ||
| Calibration 3 | 1,448,100 | ||
| ssj_ops@calibrated=1,448,109 | |||
| 100% | 99.7% | 1,448,109 | 1,443,139 |
| 90% | 90.2% | 1,303,298 | 1,306,471 |
| 80% | 79.9% | 1,158,487 | 1,157,582 |
| 70% | 70.0% | 1,013,676 | 1,013,693 |
| 60% | 60.1% | 868,865 | 870,617 |
| 50% | 50.2% | 724,055 | 726,997 |
| 40% | 39.9% | 579,244 | 577,967 |
| 30% | 30.0% | 434,433 | 434,272 |
| 20% | 20.0% | 289,622 | 289,840 |
| 10% | 10.0% | 144,811 | 145,440 |
| Active Idle | 0 | 0 | |

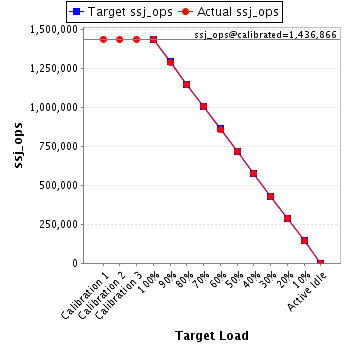
| Target Load | Actual Load | ssj_ops | |
|---|---|---|---|
| Target | Actual | ||
| Calibration 1 | 1,438,679 | ||
| Calibration 2 | 1,435,547 | ||
| Calibration 3 | 1,438,184 | ||
| ssj_ops@calibrated=1,436,866 | |||
| 100% | 99.9% | 1,436,866 | 1,435,825 |
| 90% | 89.7% | 1,293,179 | 1,289,492 |
| 80% | 80.0% | 1,149,493 | 1,149,611 |
| 70% | 70.3% | 1,005,806 | 1,009,522 |
| 60% | 59.6% | 862,119 | 856,403 |
| 50% | 50.2% | 718,433 | 720,645 |
| 40% | 40.0% | 574,746 | 574,972 |
| 30% | 29.9% | 431,060 | 429,267 |
| 20% | 20.1% | 287,373 | 288,410 |
| 10% | 10.0% | 143,687 | 144,063 |
| Active Idle | 0 | 0 | |
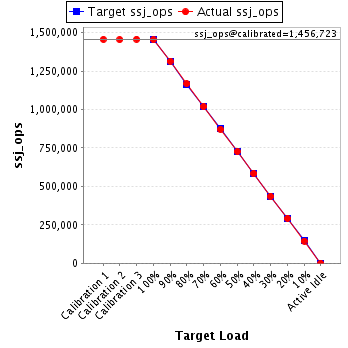
| Target Load | Actual Load | ssj_ops | |
|---|---|---|---|
| Target | Actual | ||
| Calibration 1 | 1,456,712 | ||
| Calibration 2 | 1,455,321 | ||
| Calibration 3 | 1,458,126 | ||
| ssj_ops@calibrated=1,456,723 | |||
| 100% | 99.8% | 1,456,723 | 1,454,240 |
| 90% | 90.3% | 1,311,051 | 1,315,068 |
| 80% | 80.2% | 1,165,379 | 1,168,479 |
| 70% | 70.0% | 1,019,706 | 1,019,792 |
| 60% | 59.8% | 874,034 | 871,641 |
| 50% | 49.9% | 728,362 | 726,636 |
| 40% | 40.0% | 582,689 | 583,284 |
| 30% | 30.0% | 437,017 | 436,740 |
| 20% | 20.1% | 291,345 | 292,292 |
| 10% | 9.9% | 145,672 | 144,456 |
| Active Idle | 0 | 0 | |
| Target Load | Actual Load | ssj_ops | |
|---|---|---|---|
| Target | Actual | ||
| Calibration 1 | 1,447,457 | ||
| Calibration 2 | 1,447,231 | ||
| Calibration 3 | 1,448,904 | ||
| ssj_ops@calibrated=1,448,068 | |||
| 100% | 99.7% | 1,448,068 | 1,444,221 |
| 90% | 90.1% | 1,303,261 | 1,304,354 |
| 80% | 80.0% | 1,158,454 | 1,158,864 |
| 70% | 69.9% | 1,013,647 | 1,012,485 |
| 60% | 60.0% | 868,841 | 868,791 |
| 50% | 50.1% | 724,034 | 726,083 |
| 40% | 39.9% | 579,227 | 578,020 |
| 30% | 30.1% | 434,420 | 435,447 |
| 20% | 20.0% | 289,614 | 289,954 |
| 10% | 10.0% | 144,807 | 144,200 |
| Active Idle | 0 | 0 | |
| Target Load | Actual Load | ssj_ops | |
|---|---|---|---|
| Target | Actual | ||
| Calibration 1 | 1,455,012 | ||
| Calibration 2 | 1,453,225 | ||
| Calibration 3 | 1,455,854 | ||
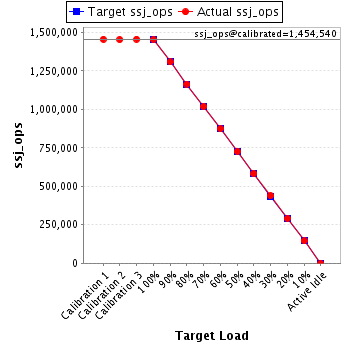
| ssj_ops@calibrated=1,454,540 | |||
| 100% | 99.8% | 1,454,540 | 1,451,715 |
| 90% | 89.9% | 1,309,086 | 1,307,573 |
| 80% | 80.1% | 1,163,632 | 1,164,503 |
| 70% | 70.1% | 1,018,178 | 1,019,156 |
| 60% | 60.0% | 872,724 | 872,657 |
| 50% | 49.9% | 727,270 | 726,513 |
| 40% | 40.0% | 581,816 | 581,404 |
| 30% | 30.1% | 436,362 | 438,431 |
| 20% | 20.0% | 290,908 | 291,049 |
| 10% | 10.0% | 145,454 | 145,206 |
| Active Idle | 0 | 0 | |