SPECpower_ssj2008
Host 'WIN-094J7GNS112' Performance Report
Copyright © 2007-2017 Standard Performance Evaluation Corporation
| Hewlett Packard Enterprise ProLiant DL360 Gen10 | ssj_ops@100% = 5,869,955 ssj_ops@100% per JVM = 1,467,489 |
||||
| Test Sponsor: | Hewlett Packard Enterprise | SPEC License #: | 3 | Test Method: | Single Node |
| Tested By: | Hewlett Packard Enterprise | Test Location: | Houston, TX, USA | Test Date: | Oct 9, 2017 |
| Hardware Availability: | Oct-2017 | Software Availability: | Apr-2015 | Publication: | Oct 25, 2017 |
| System Source: | Single Supplier | System Designation: | Server | Power Provisioning: | Line-powered |
| Target Load | Actual Load | ssj_ops | |
|---|---|---|---|
| Target | Actual | ||
| Calibration 1 | 5,887,521 | ||
| Calibration 2 | 5,887,053 | ||
| Calibration 3 | 5,887,211 | ||
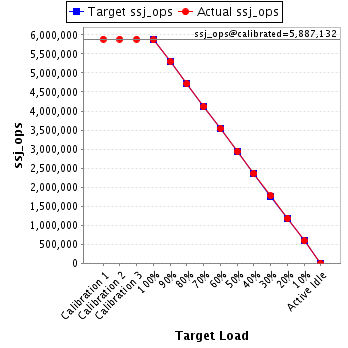
| ssj_ops@calibrated=5,887,132 | |||
| 100% | 99.7% | 5,887,132 | 5,869,955 |
| 90% | 90.0% | 5,298,419 | 5,300,124 |
| 80% | 80.1% | 4,709,706 | 4,712,888 |
| 70% | 69.9% | 4,120,992 | 4,117,662 |
| 60% | 60.1% | 3,532,279 | 3,538,212 |
| 50% | 50.0% | 2,943,566 | 2,941,672 |
| 40% | 40.0% | 2,354,853 | 2,357,786 |
| 30% | 30.0% | 1,766,140 | 1,767,298 |
| 20% | 20.0% | 1,177,426 | 1,177,979 |
| 10% | 10.0% | 588,713 | 589,575 |
| Active Idle | 0 | 0 | |
| Set Identifier: | SUT |
| Set Description: | System Under Test |
| # of Identical Nodes: | 1 |
| Comment: | SUT |
| Hardware | |
|---|---|
| Hardware Vendor: | Hewlett Packard Enterprise |
| Model: | ProLiant DL360 Gen10 |
| Form Factor: | 1U |
| CPU Name: | Intel Xeon Platinum 8180 2.50GHz |
| CPU Characteristics: | 28-Core, 2.50 GHz, 38.5MB L3 Cache |
| CPU Frequency (MHz): | 2500 |
| CPU(s) Enabled: | 56 cores, 2 chips, 28 cores/chip |
| Hardware Threads: | 112 (2 / core) |
| CPU(s) Orderable: | 1,2 chip |
| Primary Cache: | 32 KB I + 32 KB D on chip per core |
| Secondary Cache: | 1 MB I+D on chip per core |
| Tertiary Cache: | 39424 KB I+D on chip per chip |
| Other Cache: | None |
| Memory Amount (GB): | 96 |
| # and size of DIMM: | 12 x 8182 MB |
| Memory Details: | 12 x 8GB 2Rx8 PC4-2666V-RE1-12 Samsung; slots 1, 3, 5, 8, 10, and 12 populated in each socket |
| Power Supply Quantity and Rating (W): | 1 x 800 |
| Power Supply Details: | DPS-800AB (865438-B21) 96% |
| Disk Drive: | 1 x HPE Dual 150GB SATA RI uFF M.2 SSSD (880875-B21) |
| Disk Controller: | 1 x HPE Smart Array S100i SR Gen10 |
| # and type of Network Interface Cards (NICs) Installed: | 1 x HPE Ethernet 1Gb 2-port 332T Adapter (615732-B21) |
| NICs Enabled in Firmware / OS / Connected: | 2/1/1 |
| Network Speed (Mbit): | 1000 |
| Keyboard: | None |
| Mouse: | None |
| Monitor: | None |
| Optical Drives: | No |
| Other Hardware: | None |
| Software | |
|---|---|
| Power Management: | Enabled (see SUT Notes) |
| Operating System (OS): | Windows Server 2012 R2 Datacenter |
| OS Version: | Version 6.3 (Build 9600) |
| Filesystem: | NTFS |
| JVM Vendor: | Oracle Corporation |
| JVM Version: | Oracle Java HotSpot(TM) 64-Bit Server VM (build 24.80-b11, mixed mode), version 1.7.0_80 |
| JVM Command-line Options: | -server -Xmn19000m -Xms21000m -Xmx21000m -XX:SurvivorRatio=1 -XX:TargetSurvivorRatio=99 -XX:AllocatePrefetchDistance=256 -XX:AllocatePrefetchLines=4 -XX:LoopUnrollLimit=45 -XX:InitialTenuringThreshold=12 -XX:MaxTenuringThreshold=15 -XX:ParallelGCThreads=28 -XX:InlineSmallCode=3900 -XX:MaxInlineSize=270 -XX:FreqInlineSize=2500 -XX:+AggressiveOpts -XX:+UseLargePages -XX:+UseParallelOldGC |
| JVM Affinity: | start /NODE [0,1,2,3] /AFFINITY [0xFFFFFFF] |
| JVM Instances: | 4 |
| JVM Initial Heap (MB): | 21000 |
| JVM Maximum Heap (MB): | 21000 |
| JVM Address Bits: | 64 |
| Boot Firmware Version: | U32 v1.22 (09/29/2017) |
| Management Firmware Version: | 1.15 Aug 03 2017 |
| Workload Version: | SSJ 1.2.10 |
| Director Location: | Controller |
| Other Software: | None |
| JVM Instance | ssj_ops@100% |
|---|---|
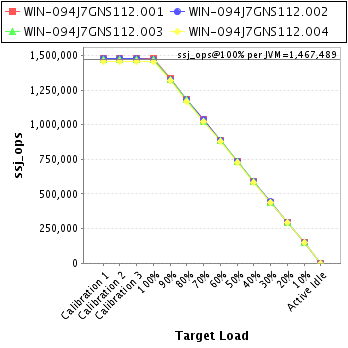
| WIN-094J7GNS112.001 | 1,474,518 |
| WIN-094J7GNS112.002 | 1,470,615 |
| WIN-094J7GNS112.003 | 1,470,650 |
| WIN-094J7GNS112.004 | 1,454,172 |
| ssj_ops@100% | 5,869,955 |
| ssj_ops@100% per JVM | 1,467,489 |
| Target Load | Actual Load | ssj_ops | |
|---|---|---|---|
| Target | Actual | ||
| Calibration 1 | 1,480,233 | ||
| Calibration 2 | 1,477,432 | ||
| Calibration 3 | 1,478,089 | ||
| ssj_ops@calibrated=1,477,760 | |||
| 100% | 99.8% | 1,477,760 | 1,474,518 |
| 90% | 90.1% | 1,329,984 | 1,331,914 |
| 80% | 80.1% | 1,182,208 | 1,183,670 |
| 70% | 70.1% | 1,034,432 | 1,035,212 |
| 60% | 60.0% | 886,656 | 887,283 |
| 50% | 49.9% | 738,880 | 737,387 |
| 40% | 40.1% | 591,104 | 592,616 |
| 30% | 29.9% | 443,328 | 441,680 |
| 20% | 20.0% | 295,552 | 296,116 |
| 10% | 10.0% | 147,776 | 148,166 |
| Active Idle | 0 | 0 | |

| Target Load | Actual Load | ssj_ops | |
|---|---|---|---|
| Target | Actual | ||
| Calibration 1 | 1,477,555 | ||
| Calibration 2 | 1,478,526 | ||
| Calibration 3 | 1,476,123 | ||
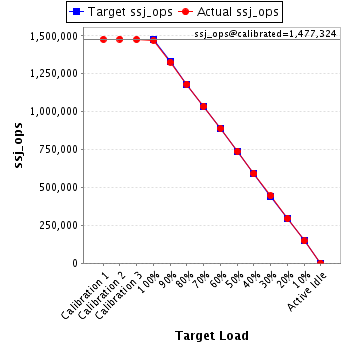
| ssj_ops@calibrated=1,477,324 | |||
| 100% | 99.5% | 1,477,324 | 1,470,615 |
| 90% | 89.8% | 1,329,592 | 1,326,747 |
| 80% | 80.0% | 1,181,860 | 1,181,451 |
| 70% | 70.1% | 1,034,127 | 1,035,706 |
| 60% | 60.2% | 886,395 | 889,576 |
| 50% | 50.0% | 738,662 | 737,994 |
| 40% | 40.0% | 590,930 | 590,244 |
| 30% | 30.1% | 443,197 | 444,920 |
| 20% | 20.0% | 295,465 | 295,599 |
| 10% | 10.0% | 147,732 | 147,383 |
| Active Idle | 0 | 0 | |
| Target Load | Actual Load | ssj_ops | |
|---|---|---|---|
| Target | Actual | ||
| Calibration 1 | 1,471,910 | ||
| Calibration 2 | 1,472,986 | ||
| Calibration 3 | 1,473,694 | ||
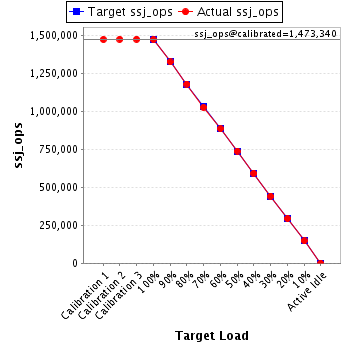
| ssj_ops@calibrated=1,473,340 | |||
| 100% | 99.8% | 1,473,340 | 1,470,650 |
| 90% | 89.8% | 1,326,006 | 1,323,587 |
| 80% | 80.0% | 1,178,672 | 1,178,620 |
| 70% | 69.6% | 1,031,338 | 1,026,043 |
| 60% | 60.0% | 884,004 | 883,850 |
| 50% | 50.1% | 736,670 | 738,024 |
| 40% | 40.1% | 589,336 | 590,833 |
| 30% | 30.0% | 442,002 | 442,036 |
| 20% | 19.9% | 294,668 | 293,804 |
| 10% | 10.0% | 147,334 | 147,151 |
| Active Idle | 0 | 0 | |
| Target Load | Actual Load | ssj_ops | |
|---|---|---|---|
| Target | Actual | ||
| Calibration 1 | 1,457,823 | ||
| Calibration 2 | 1,458,110 | ||
| Calibration 3 | 1,459,306 | ||
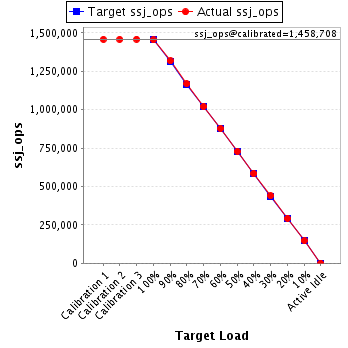
| ssj_ops@calibrated=1,458,708 | |||
| 100% | 99.7% | 1,458,708 | 1,454,172 |
| 90% | 90.3% | 1,312,837 | 1,317,876 |
| 80% | 80.1% | 1,166,966 | 1,169,147 |
| 70% | 70.0% | 1,021,095 | 1,020,701 |
| 60% | 60.2% | 875,225 | 877,503 |
| 50% | 49.9% | 729,354 | 728,267 |
| 40% | 40.0% | 583,483 | 584,094 |
| 30% | 30.1% | 437,612 | 438,663 |
| 20% | 20.0% | 291,742 | 292,460 |
| 10% | 10.1% | 145,871 | 146,875 |
| Active Idle | 0 | 0 | |