SPECpower_ssj2008
Aggregate Performance Report
Copyright © 2007-2017 Standard Performance Evaluation Corporation
| Huawei Technologies Co., Ltd FusionServer XH321 V3 | ssj_ops@100% = 15,118,177 ssj_ops@100% per Host = 3,779,544 ssj_ops@100% per JVM = 944,886 |
||||
| Test Sponsor: | Huawei Technologies Co., Ltd | SPEC License #: | 3175 | Test Method: | Multi Node |
| Tested By: | Huawei Technologies Co., Ltd | Test Location: | Shenzhen, Guangdong, China | Test Date: | Mar 4, 2017 |
| Hardware Availability: | Mar-2016 | Software Availability: | Jan-2015 | Publication: | Mar 29, 2017 |
| System Source: | Single Supplier | System Designation: | Server | Power Provisioning: | Line-powered |
| Target Load | Actual Load | ssj_ops | |
|---|---|---|---|
| Target | Actual | ||
| Calibration 1 | 15,204,793 | ||
| Calibration 2 | 15,116,577 | ||
| Calibration 3 | 15,139,545 | ||
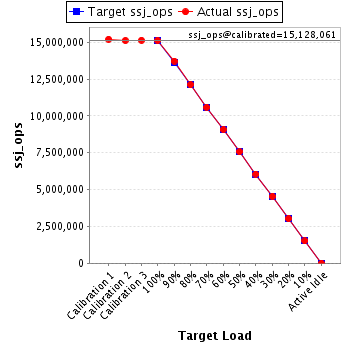
| ssj_ops@calibrated=15,128,061 | |||
| 100% | 99.9% | 15,128,061 | 15,118,177 |
| 90% | 90.7% | 13,615,255 | 13,719,313 |
| 80% | 80.0% | 12,102,449 | 12,101,725 |
| 70% | 70.0% | 10,589,643 | 10,582,490 |
| 60% | 60.0% | 9,076,837 | 9,073,073 |
| 50% | 50.0% | 7,564,030 | 7,556,630 |
| 40% | 40.0% | 6,051,224 | 6,053,057 |
| 30% | 30.0% | 4,538,418 | 4,545,054 |
| 20% | 20.0% | 3,025,612 | 3,024,488 |
| 10% | 10.0% | 1,512,806 | 1,513,554 |
| Active Idle | 0 | 0 | |
| # of Nodes | # of Chips | # of Cores | # of Threads | Total RAM (GB) | # of OS Images | # of JVM Instances |
|---|---|---|---|---|---|---|
| 4 | 8 | 176 | 352 | 256 | 4 | 16 |
| Set Identifier: | sut |
| Set Description: | System Under Test |
| # of Identical Nodes: | 4 |
| Comment: | None |
| Hardware per Node | |
|---|---|
| Hardware Vendor: | Huawei Technologies Co., Ltd |
| Model: | FusionServer XH321 V3 |
| Form Factor: | 2U |
| CPU Name: | Intel Xeon E5-2699 v4 |
| CPU Characteristics: | 22-Core, 2.2GHz, 55MB L3 Cache (Intel Turbo Boost Technology up to 3.6GHz) |
| CPU Frequency (MHz): | 2200 |
| CPU(s) Enabled: | 44 cores, 2 chips, 22 cores/chip |
| Hardware Threads: | 88 (2 / core) |
| CPU(s) Orderable: | 1,2 chips |
| Primary Cache: | 32 KB I + 32 KB D on chip per core |
| Secondary Cache: | 256 KB I+D on chip per core |
| Tertiary Cache: | 55 MB I+D on chip per chip |
| Other Cache: | None |
| Memory Amount (GB): | 64 |
| # and size of DIMM: | 8 x 8 GB |
| Memory Details: | 8GB 2Rx8 PC4-2400T ECC RDIMM;slots DIMM000, DIMM010, DIMM020, DIMM030,DIMM100, DIMM110, DIMM120, and DIMM130 populated |
| Power Supply Quantity and Rating (W): | None |
| Power Supply Details: | Shared |
| Disk Drive: | 1 x 128GB SATADOM Huawei P/N 06010307 |
| Disk Controller: | Integrated SATA controller |
| # and type of Network Interface Cards (NICs) Installed: | 1 x Dual-port Intel i350 Gigabit Ethernet controller |
| NICs Enabled in Firmware / OS / Connected: | 2/2/1 |
| Network Speed (Mbit): | 1000 |
| Keyboard: | None |
| Mouse: | None |
| Monitor: | None |
| Optical Drives: | No |
| Other Hardware: | None |
| Software per Node | |
|---|---|
| Power Management: | Power Saver Mode enabled in OS |
| Operating System (OS): | Microsoft Windows Server 2012 R2 Datacenter |
| OS Version: | Version 6.3 (Build 9600) |
| Filesystem: | NTFS |
| JVM Vendor: | Oracle Corporation |
| JVM Version: | Oracle Java HotSpot(TM) 64-Bit Server VM (build 24.80-b11, mixed mode), version 1.7.0_80 |
| JVM Command-line Options: | -server -Xmx13g -Xms13g -Xmn11g -XX:SurvivorRatio=1 -XX:TargetSurvivorRatio=99 -XX:ParallelGCThreads=22 -XX:AllocatePrefetchDistance=256 -XX:AllocatePrefetchLines=4 -XX:LoopUnrollLimit=45 -XX:InitialTenuringThreshold=12 -XX:MaxTenuringThreshold=15 -XX:InlineSmallCode=9000 -XX:MaxInlineSize=270 -XX:FreqInlineSize=6000 -XX:+UseLargePages -XX:+UseParallelOldGC -XX:+AggressiveOpts" |
| JVM Affinity: | start /NODE [0,1,2,3] /affinity [3FFFFF] |
| JVM Instances: | 4 |
| JVM Initial Heap (MB): | 13000 |
| JVM Maximum Heap (MB): | 13000 |
| JVM Address Bits: | 64 |
| Boot Firmware Version: | 3.56 |
| Management Firmware Version: | 2.33 |
| Workload Version: | SSJ 1.2.10 |
| Director Location: | Controller |
| Other Software: | none |
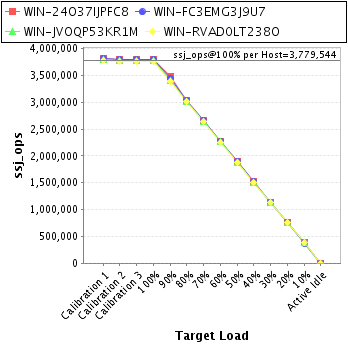
| Host | ssj_ops@100% |
|---|---|
| WIN-24O37IJPFC8 | 3,794,820 |
| WIN-FC3EMG3J9U7 | 3,790,204 |
| WIN-JVOQP53KR1M | 3,772,855 |
| WIN-RVAD0LT238O | 3,760,298 |
| ssj_ops@100% | 15,118,177 |
| ssj_ops@100% per Host | 3,779,544 |
| ssj_ops@100% per JVM | 944,886 |
| Target Load | Actual Load | ssj_ops | |
|---|---|---|---|
| Target | Actual | ||
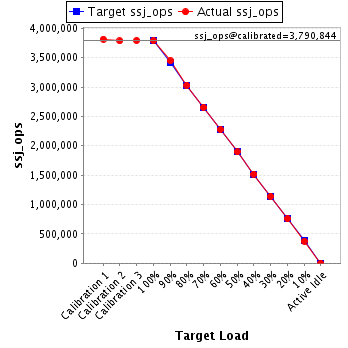
| Calibration 1 | 3,818,969 | ||
| Calibration 2 | 3,797,614 | ||
| Calibration 3 | 3,803,115 | ||
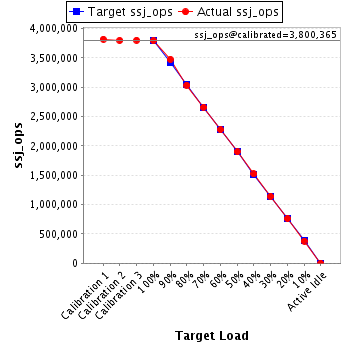
| ssj_ops@calibrated=3,800,365 | |||
| 100% | 99.9% | 3,800,365 | 3,794,820 |
| 90% | 91.5% | 3,420,328 | 3,477,145 |
| 80% | 79.9% | 3,040,292 | 3,036,142 |
| 70% | 70.0% | 2,660,255 | 2,659,835 |
| 60% | 59.9% | 2,280,219 | 2,276,082 |
| 50% | 50.0% | 1,900,182 | 1,899,658 |
| 40% | 40.1% | 1,520,146 | 1,522,108 |
| 30% | 30.0% | 1,140,109 | 1,139,536 |
| 20% | 20.0% | 760,073 | 760,029 |
| 10% | 10.0% | 380,036 | 379,327 |
| Active Idle | 0 | 0 | |
| Target Load | Actual Load | ssj_ops | |
|---|---|---|---|
| Target | Actual | ||
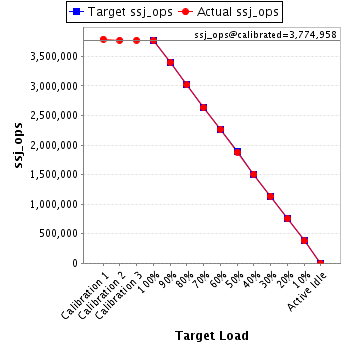
| Calibration 1 | 3,815,695 | ||
| Calibration 2 | 3,787,221 | ||
| Calibration 3 | 3,794,467 | ||
| ssj_ops@calibrated=3,790,844 | |||
| 100% | 100.0% | 3,790,844 | 3,790,204 |
| 90% | 90.9% | 3,411,760 | 3,447,647 |
| 80% | 80.0% | 3,032,675 | 3,033,380 |
| 70% | 70.0% | 2,653,591 | 2,654,284 |
| 60% | 60.0% | 2,274,507 | 2,275,378 |
| 50% | 50.0% | 1,895,422 | 1,895,081 |
| 40% | 40.1% | 1,516,338 | 1,519,227 |
| 30% | 30.0% | 1,137,253 | 1,138,504 |
| 20% | 20.0% | 758,169 | 758,878 |
| 10% | 9.9% | 379,084 | 375,314 |
| Active Idle | 0 | 0 | |
| Target Load | Actual Load | ssj_ops | |
|---|---|---|---|
| Target | Actual | ||
| Calibration 1 | 3,791,984 | ||
| Calibration 2 | 3,773,319 | ||
| Calibration 3 | 3,776,598 | ||
| ssj_ops@calibrated=3,774,958 | |||
| 100% | 99.9% | 3,774,958 | 3,772,855 |
| 90% | 90.1% | 3,397,463 | 3,401,558 |
| 80% | 80.0% | 3,019,967 | 3,018,459 |
| 70% | 69.8% | 2,642,471 | 2,634,509 |
| 60% | 60.1% | 2,264,975 | 2,268,004 |
| 50% | 49.9% | 1,887,479 | 1,882,071 |
| 40% | 40.0% | 1,509,983 | 1,508,341 |
| 30% | 30.1% | 1,132,488 | 1,135,669 |
| 20% | 20.0% | 754,992 | 753,542 |
| 10% | 10.0% | 377,496 | 378,829 |
| Active Idle | 0 | 0 | |
| Target Load | Actual Load | ssj_ops | |
|---|---|---|---|
| Target | Actual | ||
| Calibration 1 | 3,778,145 | ||
| Calibration 2 | 3,758,422 | ||
| Calibration 3 | 3,765,365 | ||
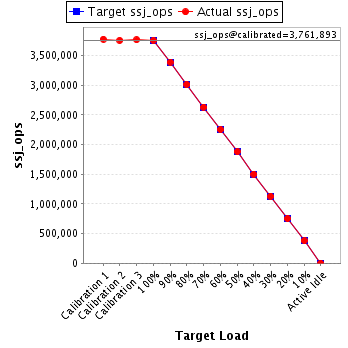
| ssj_ops@calibrated=3,761,893 | |||
| 100% | 100.0% | 3,761,893 | 3,760,298 |
| 90% | 90.2% | 3,385,704 | 3,392,962 |
| 80% | 80.1% | 3,009,515 | 3,013,744 |
| 70% | 70.0% | 2,633,325 | 2,633,862 |
| 60% | 59.9% | 2,257,136 | 2,253,609 |
| 50% | 50.0% | 1,880,947 | 1,879,820 |
| 40% | 40.0% | 1,504,757 | 1,503,381 |
| 30% | 30.1% | 1,128,568 | 1,131,344 |
| 20% | 20.0% | 752,379 | 752,039 |
| 10% | 10.1% | 376,189 | 380,085 |
| Active Idle | 0 | 0 | |