SPECpower_ssj2008
Host 'WIN-3O4CJA2S457' Performance Report
Copyright © 2007-2016 Standard Performance Evaluation Corporation
| H3C UIS R390x G2 | ssj_ops@100% = 3,422,594 ssj_ops@100% per JVM = 855,648 |
||||
| Test Sponsor: | H3C | SPEC License #: | 9066 | Test Method: | Single Node |
| Tested By: | H3C | Test Location: | Hangzhou, ZheJiang, China | Test Date: | Jul 27, 2016 |
| Hardware Availability: | Jul-2016 | Software Availability: | Apr-2015 | Publication: | Aug 24, 2016 |
| System Source: | Single Supplier | System Designation: | Server | Power Provisioning: | Line-powered |
| Target Load | Actual Load | ssj_ops | |
|---|---|---|---|
| Target | Actual | ||
| Calibration 1 | 3,378,954 | ||
| Calibration 2 | 3,476,365 | ||
| Calibration 3 | 3,479,220 | ||
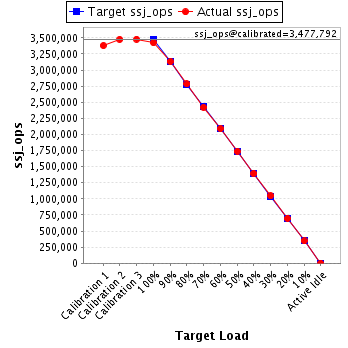
| ssj_ops@calibrated=3,477,792 | |||
| 100% | 98.4% | 3,477,792 | 3,422,594 |
| 90% | 90.1% | 3,130,013 | 3,132,546 |
| 80% | 80.0% | 2,782,234 | 2,783,568 |
| 70% | 69.6% | 2,434,455 | 2,421,804 |
| 60% | 60.1% | 2,086,675 | 2,088,638 |
| 50% | 50.0% | 1,738,896 | 1,739,861 |
| 40% | 40.0% | 1,391,117 | 1,392,560 |
| 30% | 30.1% | 1,043,338 | 1,045,220 |
| 20% | 20.0% | 695,558 | 696,501 |
| 10% | 10.0% | 347,779 | 346,448 |
| Active Idle | 0 | 0 | |
| Set Identifier: | sut |
| Set Description: | System Under Test |
| # of Identical Nodes: | 1 |
| Comment: | Here is a comment for this set. |
| Hardware | |
|---|---|
| Hardware Vendor: | H3C |
| Model: | UIS R390x G2 |
| Form Factor: | 2U |
| CPU Name: | Intel Xeon E5-2699 v4 |
| CPU Characteristics: | 22-Core, 2.20GHz, 55MB L3 Cache |
| CPU Frequency (MHz): | 2200 |
| CPU(s) Enabled: | 44 cores, 2 chips, 22 cores/chip |
| Hardware Threads: | 88 (2 / core) |
| CPU(s) Orderable: | 1,2 chips |
| Primary Cache: | 32 KB I + 32 KB D on chip per core |
| Secondary Cache: | 256 KB I+D on chip per core |
| Tertiary Cache: | 55 MB I+D on chip per chip |
| Other Cache: | None |
| Memory Amount (GB): | 64 |
| # and size of DIMM: | 8 x 8 GB |
| Memory Details: | 8GB 2Rx8 Hynix registered ECC 2400Mhz;slots 1A, 1B, 1C, 1D, 1E, 1F, 1G, 1H populated |
| Power Supply Quantity and Rating (W): | 1 x 550 |
| Power Supply Details: | ASPOWER P/N 0213A05N |
| Disk Drive: | SATA DOM 32GB P/N 0202A0UT |
| Disk Controller: | Integrated SATA controller |
| # and type of Network Interface Cards (NICs) Installed: | 4 x Intel(R) I350 Gigabit Network Connection |
| NICs Enabled in Firmware / OS / Connected: | 4/1/1 |
| Network Speed (Mbit): | 1000 |
| Keyboard: | None |
| Mouse: | None |
| Monitor: | None |
| Optical Drives: | No |
| Other Hardware: | None |
| Software | |
|---|---|
| Power Management: | Power Saver Mode enabled in OS (see SUT Notes) |
| Operating System (OS): | Microsoft Windows Server 2012 R2 Datacenter |
| OS Version: | Version 6.3 (Build 9600) |
| Filesystem: | NTFS |
| JVM Vendor: | Oracle Corporation |
| JVM Version: | Oracle Java HotSpot(TM) 64-Bit Server VM (build 24.80-b11, mixed mode), version 1.7.0_80 |
| JVM Command-line Options: | -server -Xmx15g -Xms15g -Xmn13g -XX:SurvivorRatio=1 -XX:TargetSurvivorRatio=90 -XX:ParallelGCThreads=22 -XX:AllocatePrefetchDistance=256 -XX:AllocatePrefetchLines=4 -XX:LoopUnrollLimit=45 -XX:InitialTenuringThreshold=15 -XX:MaxTenuringThreshold=15 -XX:InlineSmallCode=3900 -XX:MaxInlineSize=270 -XX:FreqInlineSize=2500 -XX:+UseLargePages -XX:+UseParallelOldGC -Xx:+OptimizeStringConcat -XX:UseStringCache |
| JVM Affinity: | start /NODE [0,1,2,3] /AFFINITY [3FFFFF] |
| JVM Instances: | 4 |
| JVM Initial Heap (MB): | 15000 |
| JVM Maximum Heap (MB): | 15000 |
| JVM Address Bits: | 64 |
| Boot Firmware Version: | 1.00.10 |
| Management Firmware Version: | 1.00.11 |
| Workload Version: | SSJ 1.2.10 |
| Director Location: | Controller |
| Other Software: | None |
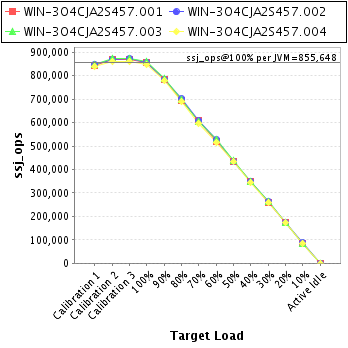
| JVM Instance | ssj_ops@100% |
|---|---|
| WIN-3O4CJA2S457.001 | 855,811 |
| WIN-3O4CJA2S457.002 | 858,540 |
| WIN-3O4CJA2S457.003 | 860,471 |
| WIN-3O4CJA2S457.004 | 847,772 |
| ssj_ops@100% | 3,422,594 |
| ssj_ops@100% per JVM | 855,648 |
| Target Load | Actual Load | ssj_ops | |
|---|---|---|---|
| Target | Actual | ||
| Calibration 1 | 843,162 | ||
| Calibration 2 | 869,583 | ||
| Calibration 3 | 870,946 | ||
| ssj_ops@calibrated=870,265 | |||
| 100% | 98.3% | 870,265 | 855,811 |
| 90% | 90.1% | 783,238 | 784,057 |
| 80% | 79.8% | 696,212 | 694,885 |
| 70% | 70.1% | 609,185 | 610,066 |
| 60% | 59.7% | 522,159 | 519,614 |
| 50% | 49.9% | 435,132 | 434,490 |
| 40% | 39.9% | 348,106 | 347,251 |
| 30% | 30.0% | 261,079 | 260,921 |
| 20% | 20.1% | 174,053 | 174,673 |
| 10% | 9.9% | 87,026 | 86,240 |
| Active Idle | 0 | 0 | |

| Target Load | Actual Load | ssj_ops | |
|---|---|---|---|
| Target | Actual | ||
| Calibration 1 | 848,449 | ||
| Calibration 2 | 870,240 | ||
| Calibration 3 | 872,555 | ||
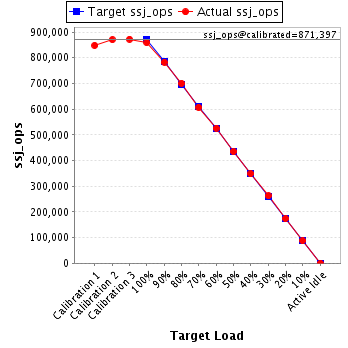
| ssj_ops@calibrated=871,397 | |||
| 100% | 98.5% | 871,397 | 858,540 |
| 90% | 89.9% | 784,258 | 783,201 |
| 80% | 80.4% | 697,118 | 700,813 |
| 70% | 69.7% | 609,978 | 607,021 |
| 60% | 60.4% | 522,838 | 526,237 |
| 50% | 50.0% | 435,699 | 435,294 |
| 40% | 39.9% | 348,559 | 348,117 |
| 30% | 30.1% | 261,419 | 262,550 |
| 20% | 19.9% | 174,279 | 173,648 |
| 10% | 10.0% | 87,140 | 87,452 |
| Active Idle | 0 | 0 | |
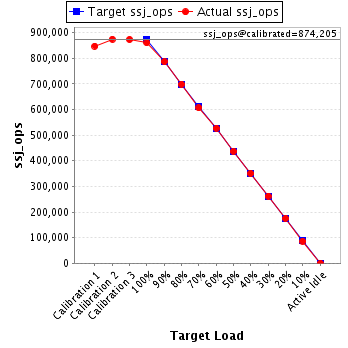
| Target Load | Actual Load | ssj_ops | |
|---|---|---|---|
| Target | Actual | ||
| Calibration 1 | 848,101 | ||
| Calibration 2 | 874,954 | ||
| Calibration 3 | 873,456 | ||
| ssj_ops@calibrated=874,205 | |||
| 100% | 98.4% | 874,205 | 860,471 |
| 90% | 90.0% | 786,785 | 786,994 |
| 80% | 80.0% | 699,364 | 699,564 |
| 70% | 69.4% | 611,944 | 606,867 |
| 60% | 60.4% | 524,523 | 527,855 |
| 50% | 50.1% | 437,103 | 437,642 |
| 40% | 40.1% | 349,682 | 350,809 |
| 30% | 30.0% | 262,262 | 262,544 |
| 20% | 20.1% | 174,841 | 175,628 |
| 10% | 9.9% | 87,421 | 86,377 |
| Active Idle | 0 | 0 | |
| Target Load | Actual Load | ssj_ops | |
|---|---|---|---|
| Target | Actual | ||
| Calibration 1 | 839,242 | ||
| Calibration 2 | 861,588 | ||
| Calibration 3 | 862,262 | ||
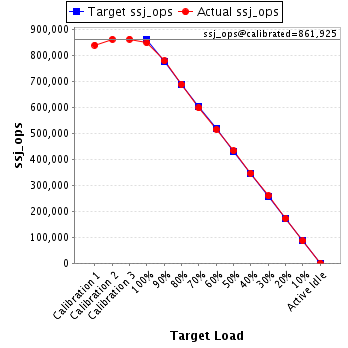
| ssj_ops@calibrated=861,925 | |||
| 100% | 98.4% | 861,925 | 847,772 |
| 90% | 90.3% | 775,732 | 778,294 |
| 80% | 79.9% | 689,540 | 688,306 |
| 70% | 69.4% | 603,347 | 597,851 |
| 60% | 59.7% | 517,155 | 514,932 |
| 50% | 50.2% | 430,962 | 432,434 |
| 40% | 40.2% | 344,770 | 346,384 |
| 30% | 30.1% | 258,577 | 259,206 |
| 20% | 20.0% | 172,385 | 172,552 |
| 10% | 10.0% | 86,192 | 86,379 |
| Active Idle | 0 | 0 | |