SPECpower_ssj2008
Host 'WIN-O2D0BKUQ5B7' Performance Report
Copyright © 2007-2016 Standard Performance Evaluation Corporation
| Quanta Computer Inc. QuantaGrid D51B-2U | ssj_ops@100% = 3,381,238 ssj_ops@100% per JVM = 845,310 |
||||
| Test Sponsor: | Quanta Computer Inc. | SPEC License #: | 9050 | Test Method: | Single Node |
| Tested By: | Quanta Computer Inc. | Test Location: | Taoyuan, TW, R.O.C | Test Date: | May 20, 2016 |
| Hardware Availability: | Mar-2016 | Software Availability: | Apr-2015 | Publication: | Jun 8, 2016 |
| System Source: | Single Supplier | System Designation: | Server | Power Provisioning: | Line-powered |
| Target Load | Actual Load | ssj_ops | |
|---|---|---|---|
| Target | Actual | ||
| Calibration 1 | 3,364,971 | ||
| Calibration 2 | 3,394,244 | ||
| Calibration 3 | 3,378,856 | ||
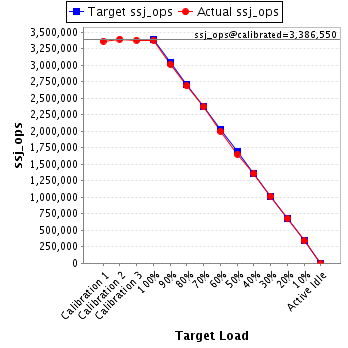
| ssj_ops@calibrated=3,386,550 | |||
| 100% | 99.8% | 3,386,550 | 3,381,238 |
| 90% | 88.9% | 3,047,895 | 3,011,564 |
| 80% | 79.4% | 2,709,240 | 2,687,771 |
| 70% | 69.9% | 2,370,585 | 2,366,949 |
| 60% | 59.0% | 2,031,930 | 1,998,642 |
| 50% | 48.8% | 1,693,275 | 1,653,215 |
| 40% | 40.0% | 1,354,620 | 1,356,241 |
| 30% | 30.0% | 1,015,965 | 1,016,848 |
| 20% | 20.0% | 677,310 | 677,618 |
| 10% | 10.0% | 338,655 | 338,889 |
| Active Idle | 0 | 0 | |
| Set Identifier: | D51B-2U |
| Set Description: | System Under Test |
| # of Identical Nodes: | 1 |
| Comment: | None |
| Hardware | |
|---|---|
| Hardware Vendor: | Quanta Computer Inc. |
| Model: | QuantaGrid D51B-2U |
| Form Factor: | 2U |
| CPU Name: | Intel Xeon E5-2699 v4 |
| CPU Characteristics: | 22 core, 2.2GHz, 55MB L3 Cache |
| CPU Frequency (MHz): | 2200 |
| CPU(s) Enabled: | 44 cores, 2 chips, 22 cores/chip |
| Hardware Threads: | 88 (2 / core) |
| CPU(s) Orderable: | 1,2 chips |
| Primary Cache: | 32 KB I + 32 KB D on chip per core |
| Secondary Cache: | 256 KB I+D on chip per chip |
| Tertiary Cache: | 55 MB I+D on chip per chip |
| Other Cache: | None |
| Memory Amount (GB): | 64 |
| # and size of DIMM: | 8 x 8 GB |
| Memory Details: | 8GB 1Rx8 PC4-2400T-RDB-10; slots A0, B0, C0, D0, E0, F0, G0 ,H0 populated |
| Power Supply Quantity and Rating (W): | 1 x 500 |
| Power Supply Details: | Quanta P/N 1HY9ZZZ0291 |
| Disk Drive: | 1 x 800G SATA SSD,Quanta P/N ABSAK800000 |
| Disk Controller: | Integrated SATA controller |
| # and type of Network Interface Cards (NICs) Installed: | 1 x Integrated Intel Ethernet Controller I350, 2-port |
| NICs Enabled in Firmware / OS / Connected: | 2/2/1 |
| Network Speed (Mbit): | 1000 |
| Keyboard: | None |
| Mouse: | None |
| Monitor: | None |
| Optical Drives: | No |
| Other Hardware: | None |
| Software | |
|---|---|
| Power Management: | Balanced power plan in OS |
| Operating System (OS): | Microsoft Microsoft Windows Server 2012 R2 Datacenter |
| OS Version: | Version 6.3.9600 |
| Filesystem: | NTFS |
| JVM Vendor: | Oracle Corporation |
| JVM Version: | Java HotSpot 64-Bit Server VM (build 24.80-b11, mixed mode), version 1.7.0_80 |
| JVM Command-line Options: | -server -Xmn11g -Xms13g -Xmx13g -XX:SurvivorRatio=60 -XX:TargetSurvivorRatio=90 -XX:AllocatePrefetchDistance=256 -XX:AllocatePrefetchLines=4 -XX:LoopUnrollLimit=45 -XX:InitialTenuringThreshold=12 -XX:MaxTenuringThreshold=15 -XX:ParallelGCThreads=22 -XX:InlineSmallCode=3900 -XX:MaxInlineSize=270 -XX:FreqInlineSize=2500 -XX:+AggressiveOpts -XX:+UseLargePages -XX:+UseParallelOldGC -XX:-UseAdaptiveSizePolicy |
| JVM Affinity: | start /NODE [0,1,2,3] /AFFINITY 0x3FFFFF |
| JVM Instances: | 4 |
| JVM Initial Heap (MB): | 13000 |
| JVM Maximum Heap (MB): | 13000 |
| JVM Address Bits: | 64 |
| Boot Firmware Version: | S2B_3B04 |
| Management Firmware Version: | 3.45.00 |
| Workload Version: | SSJ 1.2.10 |
| Director Location: | Controller |
| Other Software: | None |
| JVM Instance | ssj_ops@100% |
|---|---|
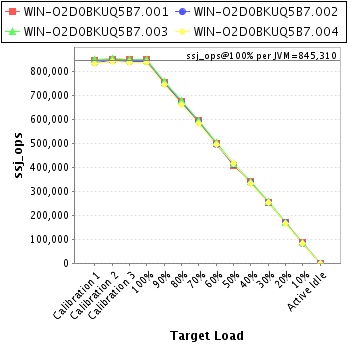
| WIN-O2D0BKUQ5B7.001 | 850,132 |
| WIN-O2D0BKUQ5B7.002 | 841,907 |
| WIN-O2D0BKUQ5B7.003 | 851,069 |
| WIN-O2D0BKUQ5B7.004 | 838,130 |
| ssj_ops@100% | 3,381,238 |
| ssj_ops@100% per JVM | 845,310 |
| Target Load | Actual Load | ssj_ops | |
|---|---|---|---|
| Target | Actual | ||
| Calibration 1 | 846,550 | ||
| Calibration 2 | 851,996 | ||
| Calibration 3 | 850,258 | ||
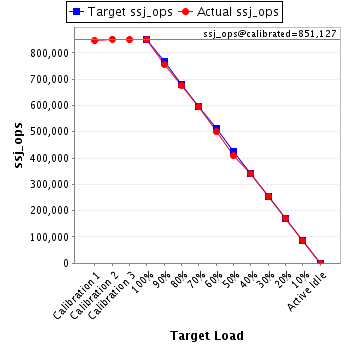
| ssj_ops@calibrated=851,127 | |||
| 100% | 99.9% | 851,127 | 850,132 |
| 90% | 88.8% | 766,014 | 755,794 |
| 80% | 79.4% | 680,902 | 675,630 |
| 70% | 69.8% | 595,789 | 594,406 |
| 60% | 58.8% | 510,676 | 500,076 |
| 50% | 48.0% | 425,564 | 408,405 |
| 40% | 40.0% | 340,451 | 340,065 |
| 30% | 30.0% | 255,338 | 255,272 |
| 20% | 19.9% | 170,225 | 169,554 |
| 10% | 10.0% | 85,113 | 85,417 |
| Active Idle | 0 | 0 | |
| Target Load | Actual Load | ssj_ops | |
|---|---|---|---|
| Target | Actual | ||
| Calibration 1 | 836,531 | ||
| Calibration 2 | 845,315 | ||
| Calibration 3 | 841,289 | ||
| ssj_ops@calibrated=843,302 | |||
| 100% | 99.8% | 843,302 | 841,907 |
| 90% | 89.0% | 758,972 | 750,337 |
| 80% | 79.5% | 674,642 | 670,340 |
| 70% | 70.1% | 590,311 | 590,980 |
| 60% | 59.0% | 505,981 | 497,250 |
| 50% | 48.8% | 421,651 | 411,324 |
| 40% | 40.2% | 337,321 | 338,707 |
| 30% | 29.9% | 252,991 | 252,382 |
| 20% | 20.1% | 168,660 | 169,155 |
| 10% | 10.0% | 84,330 | 84,374 |
| Active Idle | 0 | 0 | |

| Target Load | Actual Load | ssj_ops | |
|---|---|---|---|
| Target | Actual | ||
| Calibration 1 | 849,438 | ||
| Calibration 2 | 855,881 | ||
| Calibration 3 | 851,278 | ||
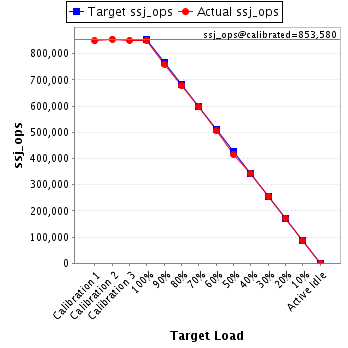
| ssj_ops@calibrated=853,580 | |||
| 100% | 99.7% | 853,580 | 851,069 |
| 90% | 89.1% | 768,222 | 760,509 |
| 80% | 79.4% | 682,864 | 677,636 |
| 70% | 69.9% | 597,506 | 596,889 |
| 60% | 59.2% | 512,148 | 505,247 |
| 50% | 48.7% | 426,790 | 415,634 |
| 40% | 40.2% | 341,432 | 342,725 |
| 30% | 30.1% | 256,074 | 256,752 |
| 20% | 20.1% | 170,716 | 171,424 |
| 10% | 10.0% | 85,358 | 85,638 |
| Active Idle | 0 | 0 | |
| Target Load | Actual Load | ssj_ops | |
|---|---|---|---|
| Target | Actual | ||
| Calibration 1 | 832,452 | ||
| Calibration 2 | 841,052 | ||
| Calibration 3 | 836,031 | ||
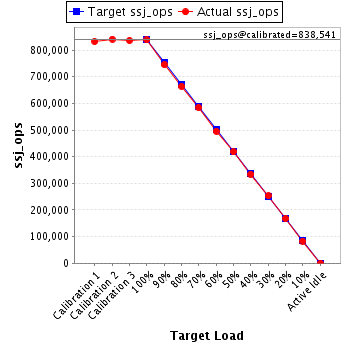
| ssj_ops@calibrated=838,541 | |||
| 100% | 100.0% | 838,541 | 838,130 |
| 90% | 88.8% | 754,687 | 744,924 |
| 80% | 79.2% | 670,833 | 664,165 |
| 70% | 69.7% | 586,979 | 584,673 |
| 60% | 59.2% | 503,125 | 496,069 |
| 50% | 49.8% | 419,271 | 417,852 |
| 40% | 39.9% | 335,417 | 334,744 |
| 30% | 30.1% | 251,562 | 252,441 |
| 20% | 20.0% | 167,708 | 167,485 |
| 10% | 10.0% | 83,854 | 83,461 |
| Active Idle | 0 | 0 | |