SPECpower_ssj2008
Host 'SUT-02' Performance Report
Copyright © 2007-2016 Standard Performance Evaluation Corporation
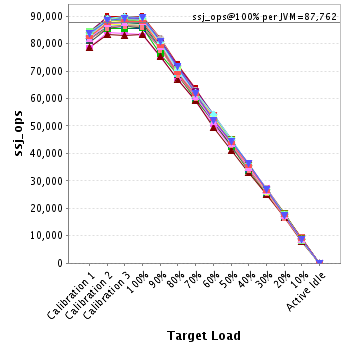
| Hewlett Packard Enterprise ProLiant DL360 Gen9 | ssj_ops@100% = 3,159,419 ssj_ops@100% per JVM = 87,762 |
||||
| Test Sponsor: | Hewlett Packard Enterprise | SPEC License #: | 3 | Test Method: | Single Node |
| Tested By: | Hewlett Packard Enterprise | Test Location: | Houston, TX, USA | Test Date: | Sep 8, 2015 |
| Hardware Availability: | Nov-2015 | Software Availability: | Jun-2013 | Publication: | Jan 7, 2016 |
| System Source: | Single Supplier | System Designation: | Server | Power Provisioning: | Line-powered |
| Target Load | Actual Load | ssj_ops | |
|---|---|---|---|
| Target | Actual | ||
| Calibration 1 | 2,971,239 | ||
| Calibration 2 | 3,155,191 | ||
| Calibration 3 | 3,165,493 | ||
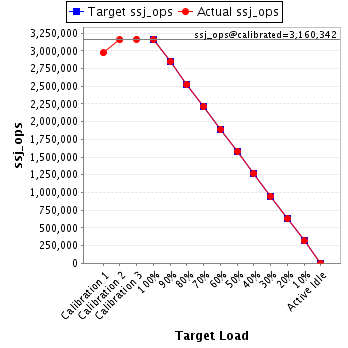
| ssj_ops@calibrated=3,160,342 | |||
| 100% | 100.0% | 3,160,342 | 3,159,419 |
| 90% | 90.2% | 2,844,308 | 2,851,258 |
| 80% | 79.9% | 2,528,273 | 2,525,861 |
| 70% | 70.0% | 2,212,239 | 2,212,076 |
| 60% | 60.0% | 1,896,205 | 1,894,880 |
| 50% | 50.0% | 1,580,171 | 1,579,461 |
| 40% | 40.1% | 1,264,137 | 1,266,259 |
| 30% | 30.1% | 948,103 | 949,976 |
| 20% | 19.9% | 632,068 | 629,838 |
| 10% | 10.0% | 316,034 | 315,004 |
| Active Idle | 0 | 0 | |
| Set Identifier: | SUT |
| Set Description: | System Under Test |
| # of Identical Nodes: | 1 |
| Comment: | SUT |
| Hardware | |
|---|---|
| Hardware Vendor: | Hewlett Packard Enterprise |
| Model: | ProLiant DL360 Gen9 |
| Form Factor: | 1U |
| CPU Name: | Intel Xeon E5-2699 v3 2.30 GHz |
| CPU Characteristics: | 18-Core, 2.30 GHz, 45MB L3 Cache |
| CPU Frequency (MHz): | 2300 |
| CPU(s) Enabled: | 36 cores, 2 chips, 18 cores/chip |
| Hardware Threads: | 72 (2 / core) |
| CPU(s) Orderable: | 1,2 chips |
| Primary Cache: | 32 KB I + 32 KB D on chip per core |
| Secondary Cache: | 256 KB I+D on chip per core |
| Tertiary Cache: | 45 MB I+D on chip per chip |
| Other Cache: | None |
| Memory Amount (GB): | 64 |
| # and size of DIMM: | 8 x 8182 MB |
| Memory Details: | 8 GB 2Rx8 PC4-2133P; slots 1, 4, 9 and 12 populated on each socket |
| Power Supply Quantity and Rating (W): | 1 x 800 |
| Power Supply Details: | HP 800W Flex Slot Titanium Hot Plug Power Supply Kit (720482-B21) |
| Disk Drive: | 1 x 400GB SSD SATA (691842-003) |
| Disk Controller: | embedded SATA |
| # and type of Network Interface Cards (NICs) Installed: | 1 x HPE Ethernet 1Gb 4-port 331i Adapter |
| NICs Enabled in Firmware / OS / Connected: | 4/4/1 |
| Network Speed (Mbit): | 1000 |
| Keyboard: | None |
| Mouse: | None |
| Monitor: | None |
| Optical Drives: | No |
| Other Hardware: | None |
| Software | |
|---|---|
| Power Management: | Enabled (see SUT Notes) |
| Operating System (OS): | Microsoft Windows Server Enterprise 2008 R2 SP1 |
| OS Version: | Version 6.1 (Build 7601) |
| Filesystem: | NTFS |
| JVM Vendor: | IBM Corporation |
| JVM Version: | IBM J9 VM (build 2.6, JRE 1.7.0 Windows Server 2008 amd64-64 20120322_106209 (JIT enabled, AOT enabled) |
| JVM Command-line Options: | -Xmx975m -Xms975m -Xmn825m -Xaggressive -Xcompressedrefs -Xgcpolicy:gencon -XlockReservation -Xnoloa -XtlhPrefetch -Xlp -Xconcurrentlevel0 -Xthr:minimizeusercpu -Xgc:preferredHeapBase=0x80000000 -Xgcthreads2 |
| JVM Affinity: | start /NODE [0,1,2,3] /AFFINITY [0x3, 0xc, 0x30, 0xc0, 0x300, 0xc00, 0x3000, 0xc000, 0x3000] |
| JVM Instances: | 36 |
| JVM Initial Heap (MB): | 975 |
| JVM Maximum Heap (MB): | 975 |
| JVM Address Bits: | 64 |
| Boot Firmware Version: | P89 1.50 07/20/2015 |
| Management Firmware Version: | 2.30 pass 22 Jun 25 2015 |
| Workload Version: | SSJ 1.2.10 |
| Director Location: | Controller |
| Other Software: | IBM WebSphere Application Server V8.5.0.0, Microsoft Hotfix for Windows (KB2510206) |
| JVM Instance | ssj_ops@100% |
|---|---|
| SUT-02.001 | 88,562 |
| SUT-02.002 | 88,482 |
| SUT-02.003 | 88,208 |
| SUT-02.004 | 88,582 |
| SUT-02.005 | 83,142 |
| SUT-02.006 | 88,365 |
| SUT-02.007 | 87,812 |
| SUT-02.008 | 88,080 |
| SUT-02.009 | 89,719 |
| SUT-02.010 | 85,644 |
| SUT-02.011 | 85,723 |
| SUT-02.012 | 88,127 |
| SUT-02.013 | 87,754 |
| SUT-02.014 | 89,143 |
| SUT-02.015 | 85,635 |
| SUT-02.016 | 88,777 |
| SUT-02.017 | 87,162 |
| SUT-02.018 | 88,943 |
| SUT-02.019 | 86,664 |
| SUT-02.020 | 88,710 |
| SUT-02.021 | 88,625 |
| SUT-02.022 | 89,160 |
| SUT-02.023 | 83,392 |
| SUT-02.024 | 87,918 |
| SUT-02.025 | 87,351 |
| SUT-02.026 | 88,057 |
| SUT-02.027 | 89,046 |
| SUT-02.028 | 86,403 |
| SUT-02.029 | 86,150 |
| SUT-02.030 | 88,744 |
| SUT-02.031 | 88,510 |
| SUT-02.032 | 87,904 |
| SUT-02.033 | 88,079 |
| SUT-02.034 | 89,417 |
| SUT-02.035 | 88,026 |
| SUT-02.036 | 89,402 |
| ssj_ops@100% | 3,159,419 |
| ssj_ops@100% per JVM | 87,762 |
| Target Load | Actual Load | ssj_ops | |
|---|---|---|---|
| Target | Actual | ||
| Calibration 1 | 83,275 | ||
| Calibration 2 | 88,176 | ||
| Calibration 3 | 88,762 | ||
| ssj_ops@calibrated=88,469 | |||
| 100% | 100.1% | 88,469 | 88,562 |
| 90% | 90.1% | 79,622 | 79,728 |
| 80% | 79.2% | 70,775 | 70,072 |
| 70% | 69.2% | 61,928 | 61,179 |
| 60% | 60.1% | 53,081 | 53,164 |
| 50% | 49.9% | 44,235 | 44,183 |
| 40% | 40.5% | 35,388 | 35,848 |
| 30% | 29.7% | 26,541 | 26,244 |
| 20% | 19.7% | 17,694 | 17,388 |
| 10% | 10.4% | 8,847 | 9,229 |
| Active Idle | 0 | 0 | |

| Target Load | Actual Load | ssj_ops | |
|---|---|---|---|
| Target | Actual | ||
| Calibration 1 | 82,494 | ||
| Calibration 2 | 88,352 | ||
| Calibration 3 | 88,009 | ||
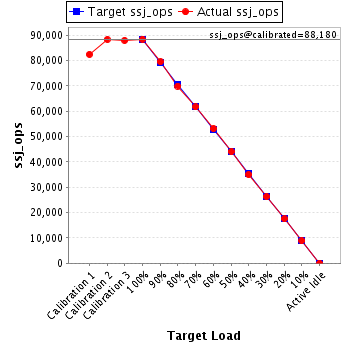
| ssj_ops@calibrated=88,180 | |||
| 100% | 100.3% | 88,180 | 88,482 |
| 90% | 90.2% | 79,362 | 79,577 |
| 80% | 79.4% | 70,544 | 69,984 |
| 70% | 70.0% | 61,726 | 61,718 |
| 60% | 60.3% | 52,908 | 53,137 |
| 50% | 50.0% | 44,090 | 44,065 |
| 40% | 39.7% | 35,272 | 35,006 |
| 30% | 29.8% | 26,454 | 26,296 |
| 20% | 19.9% | 17,636 | 17,537 |
| 10% | 10.1% | 8,818 | 8,912 |
| Active Idle | 0 | 0 | |
| Target Load | Actual Load | ssj_ops | |
|---|---|---|---|
| Target | Actual | ||
| Calibration 1 | 83,275 | ||
| Calibration 2 | 88,100 | ||
| Calibration 3 | 88,297 | ||
| ssj_ops@calibrated=88,198 | |||
| 100% | 100.0% | 88,198 | 88,208 |
| 90% | 90.3% | 79,378 | 79,669 |
| 80% | 80.2% | 70,559 | 70,748 |
| 70% | 71.3% | 61,739 | 62,878 |
| 60% | 60.2% | 52,919 | 53,117 |
| 50% | 50.3% | 44,099 | 44,331 |
| 40% | 40.2% | 35,279 | 35,432 |
| 30% | 29.9% | 26,459 | 26,369 |
| 20% | 20.1% | 17,640 | 17,716 |
| 10% | 10.1% | 8,820 | 8,937 |
| Active Idle | 0 | 0 | |

| Target Load | Actual Load | ssj_ops | |
|---|---|---|---|
| Target | Actual | ||
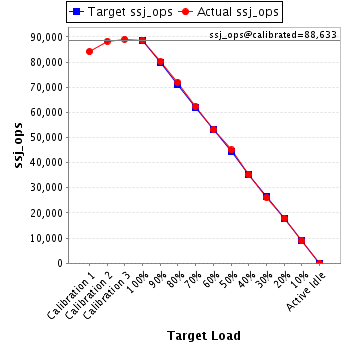
| Calibration 1 | 84,101 | ||
| Calibration 2 | 88,184 | ||
| Calibration 3 | 89,082 | ||
| ssj_ops@calibrated=88,633 | |||
| 100% | 99.9% | 88,633 | 88,582 |
| 90% | 90.5% | 79,770 | 80,173 |
| 80% | 81.2% | 70,907 | 71,934 |
| 70% | 70.3% | 62,043 | 62,325 |
| 60% | 59.9% | 53,180 | 53,064 |
| 50% | 50.8% | 44,317 | 45,056 |
| 40% | 39.7% | 35,453 | 35,218 |
| 30% | 29.5% | 26,590 | 26,150 |
| 20% | 20.2% | 17,727 | 17,891 |
| 10% | 10.1% | 8,863 | 8,962 |
| Active Idle | 0 | 0 | |
| Target Load | Actual Load | ssj_ops | |
|---|---|---|---|
| Target | Actual | ||
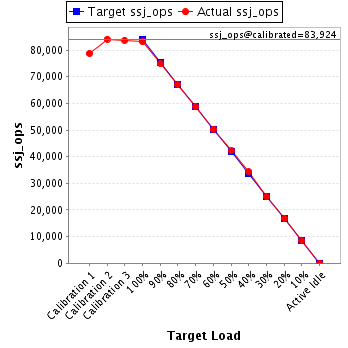
| Calibration 1 | 78,734 | ||
| Calibration 2 | 84,130 | ||
| Calibration 3 | 83,718 | ||
| ssj_ops@calibrated=83,924 | |||
| 100% | 99.1% | 83,924 | 83,142 |
| 90% | 89.4% | 75,531 | 75,004 |
| 80% | 80.0% | 67,139 | 67,131 |
| 70% | 70.1% | 58,747 | 58,832 |
| 60% | 60.0% | 50,354 | 50,388 |
| 50% | 50.3% | 41,962 | 42,222 |
| 40% | 40.9% | 33,570 | 34,312 |
| 30% | 29.9% | 25,177 | 25,078 |
| 20% | 20.1% | 16,785 | 16,870 |
| 10% | 10.1% | 8,392 | 8,508 |
| Active Idle | 0 | 0 | |
| Target Load | Actual Load | ssj_ops | |
|---|---|---|---|
| Target | Actual | ||
| Calibration 1 | 82,226 | ||
| Calibration 2 | 88,436 | ||
| Calibration 3 | 88,504 | ||
| ssj_ops@calibrated=88,470 | |||
| 100% | 99.9% | 88,470 | 88,365 |
| 90% | 89.8% | 79,623 | 79,419 |
| 80% | 80.0% | 70,776 | 70,793 |
| 70% | 70.0% | 61,929 | 61,968 |
| 60% | 59.7% | 53,082 | 52,800 |
| 50% | 50.7% | 44,235 | 44,823 |
| 40% | 39.6% | 35,388 | 35,012 |
| 30% | 30.1% | 26,541 | 26,607 |
| 20% | 19.9% | 17,694 | 17,567 |
| 10% | 9.7% | 8,847 | 8,604 |
| Active Idle | 0 | 0 | |

| Target Load | Actual Load | ssj_ops | |
|---|---|---|---|
| Target | Actual | ||
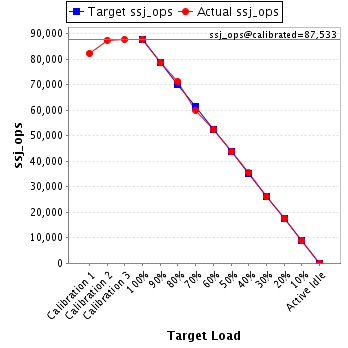
| Calibration 1 | 82,221 | ||
| Calibration 2 | 87,382 | ||
| Calibration 3 | 87,684 | ||
| ssj_ops@calibrated=87,533 | |||
| 100% | 100.3% | 87,533 | 87,812 |
| 90% | 89.8% | 78,780 | 78,580 |
| 80% | 81.3% | 70,027 | 71,158 |
| 70% | 68.6% | 61,273 | 60,023 |
| 60% | 59.9% | 52,520 | 52,455 |
| 50% | 50.1% | 43,767 | 43,818 |
| 40% | 40.4% | 35,013 | 35,371 |
| 30% | 29.7% | 26,260 | 25,994 |
| 20% | 20.2% | 17,507 | 17,686 |
| 10% | 10.1% | 8,753 | 8,884 |
| Active Idle | 0 | 0 | |
| Target Load | Actual Load | ssj_ops | |
|---|---|---|---|
| Target | Actual | ||
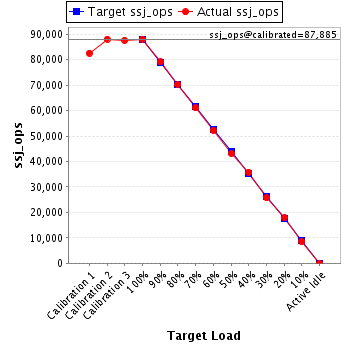
| Calibration 1 | 82,638 | ||
| Calibration 2 | 88,088 | ||
| Calibration 3 | 87,683 | ||
| ssj_ops@calibrated=87,885 | |||
| 100% | 100.2% | 87,885 | 88,080 |
| 90% | 90.0% | 79,097 | 79,129 |
| 80% | 79.9% | 70,308 | 70,224 |
| 70% | 69.5% | 61,520 | 61,041 |
| 60% | 59.4% | 52,731 | 52,187 |
| 50% | 49.1% | 43,943 | 43,144 |
| 40% | 40.7% | 35,154 | 35,733 |
| 30% | 29.3% | 26,366 | 25,774 |
| 20% | 20.3% | 17,577 | 17,830 |
| 10% | 9.8% | 8,789 | 8,574 |
| Active Idle | 0 | 0 | |
| Target Load | Actual Load | ssj_ops | |
|---|---|---|---|
| Target | Actual | ||
| Calibration 1 | 84,049 | ||
| Calibration 2 | 89,930 | ||
| Calibration 3 | 89,905 | ||
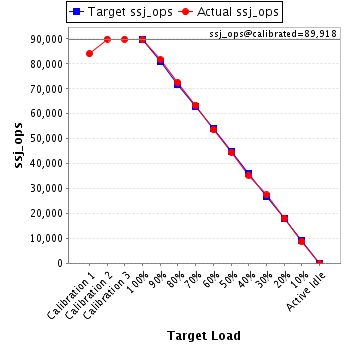
| ssj_ops@calibrated=89,918 | |||
| 100% | 99.8% | 89,918 | 89,719 |
| 90% | 90.9% | 80,926 | 81,721 |
| 80% | 80.6% | 71,934 | 72,507 |
| 70% | 70.6% | 62,942 | 63,507 |
| 60% | 59.6% | 53,951 | 53,561 |
| 50% | 49.7% | 44,959 | 44,648 |
| 40% | 39.3% | 35,967 | 35,362 |
| 30% | 30.5% | 26,975 | 27,408 |
| 20% | 20.1% | 17,984 | 18,080 |
| 10% | 9.7% | 8,992 | 8,746 |
| Active Idle | 0 | 0 | |
| Target Load | Actual Load | ssj_ops | |
|---|---|---|---|
| Target | Actual | ||
| Calibration 1 | 81,756 | ||
| Calibration 2 | 85,886 | ||
| Calibration 3 | 85,466 | ||
| ssj_ops@calibrated=85,676 | |||
| 100% | 100.0% | 85,676 | 85,644 |
| 90% | 91.4% | 77,109 | 78,335 |
| 80% | 80.1% | 68,541 | 68,663 |
| 70% | 70.0% | 59,973 | 59,936 |
| 60% | 60.8% | 51,406 | 52,103 |
| 50% | 50.1% | 42,838 | 42,887 |
| 40% | 40.8% | 34,270 | 34,946 |
| 30% | 30.3% | 25,703 | 25,919 |
| 20% | 19.8% | 17,135 | 16,954 |
| 10% | 10.4% | 8,568 | 8,937 |
| Active Idle | 0 | 0 | |

| Target Load | Actual Load | ssj_ops | |
|---|---|---|---|
| Target | Actual | ||
| Calibration 1 | 81,996 | ||
| Calibration 2 | 85,405 | ||
| Calibration 3 | 85,648 | ||
| ssj_ops@calibrated=85,526 | |||
| 100% | 100.2% | 85,526 | 85,723 |
| 90% | 89.1% | 76,974 | 76,216 |
| 80% | 80.3% | 68,421 | 68,715 |
| 70% | 69.8% | 59,868 | 59,729 |
| 60% | 60.4% | 51,316 | 51,681 |
| 50% | 49.9% | 42,763 | 42,690 |
| 40% | 39.6% | 34,210 | 33,906 |
| 30% | 29.9% | 25,658 | 25,534 |
| 20% | 20.1% | 17,105 | 17,163 |
| 10% | 9.9% | 8,553 | 8,486 |
| Active Idle | 0 | 0 | |

| Target Load | Actual Load | ssj_ops | |
|---|---|---|---|
| Target | Actual | ||
| Calibration 1 | 82,795 | ||
| Calibration 2 | 88,297 | ||
| Calibration 3 | 88,697 | ||
| ssj_ops@calibrated=88,497 | |||
| 100% | 99.6% | 88,497 | 88,127 |
| 90% | 89.5% | 79,647 | 79,221 |
| 80% | 79.2% | 70,798 | 70,127 |
| 70% | 69.4% | 61,948 | 61,388 |
| 60% | 60.2% | 53,098 | 53,281 |
| 50% | 49.6% | 44,248 | 43,897 |
| 40% | 40.5% | 35,399 | 35,844 |
| 30% | 29.4% | 26,549 | 26,058 |
| 20% | 19.8% | 17,699 | 17,496 |
| 10% | 10.0% | 8,850 | 8,816 |
| Active Idle | 0 | 0 | |

| Target Load | Actual Load | ssj_ops | |
|---|---|---|---|
| Target | Actual | ||
| Calibration 1 | 82,956 | ||
| Calibration 2 | 87,374 | ||
| Calibration 3 | 88,279 | ||
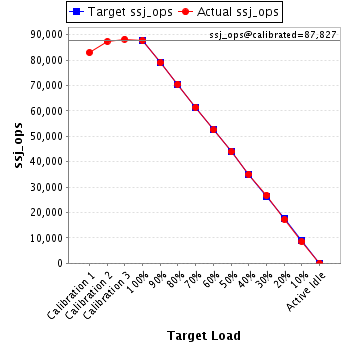
| ssj_ops@calibrated=87,827 | |||
| 100% | 99.9% | 87,827 | 87,754 |
| 90% | 90.0% | 79,044 | 79,050 |
| 80% | 80.3% | 70,261 | 70,531 |
| 70% | 70.0% | 61,479 | 61,462 |
| 60% | 59.8% | 52,696 | 52,502 |
| 50% | 50.0% | 43,913 | 43,940 |
| 40% | 39.9% | 35,131 | 35,056 |
| 30% | 30.5% | 26,348 | 26,771 |
| 20% | 19.6% | 17,565 | 17,245 |
| 10% | 9.7% | 8,783 | 8,516 |
| Active Idle | 0 | 0 | |
| Target Load | Actual Load | ssj_ops | |
|---|---|---|---|
| Target | Actual | ||
| Calibration 1 | 83,542 | ||
| Calibration 2 | 88,616 | ||
| Calibration 3 | 89,157 | ||
| ssj_ops@calibrated=88,886 | |||
| 100% | 100.3% | 88,886 | 89,143 |
| 90% | 88.7% | 79,998 | 78,876 |
| 80% | 79.5% | 71,109 | 70,653 |
| 70% | 70.4% | 62,220 | 62,534 |
| 60% | 60.9% | 53,332 | 54,099 |
| 50% | 49.7% | 44,443 | 44,160 |
| 40% | 40.3% | 35,555 | 35,778 |
| 30% | 30.0% | 26,666 | 26,668 |
| 20% | 19.7% | 17,777 | 17,512 |
| 10% | 10.0% | 8,889 | 8,858 |
| Active Idle | 0 | 0 | |

| Target Load | Actual Load | ssj_ops | |
|---|---|---|---|
| Target | Actual | ||
| Calibration 1 | 80,520 | ||
| Calibration 2 | 85,563 | ||
| Calibration 3 | 86,490 | ||
| ssj_ops@calibrated=86,026 | |||
| 100% | 99.5% | 86,026 | 85,635 |
| 90% | 91.3% | 77,424 | 78,522 |
| 80% | 79.4% | 68,821 | 68,339 |
| 70% | 70.8% | 60,219 | 60,871 |
| 60% | 59.6% | 51,616 | 51,284 |
| 50% | 49.9% | 43,013 | 42,953 |
| 40% | 39.6% | 34,411 | 34,052 |
| 30% | 30.5% | 25,808 | 26,253 |
| 20% | 20.3% | 17,205 | 17,454 |
| 10% | 10.3% | 8,603 | 8,883 |
| Active Idle | 0 | 0 | |

| Target Load | Actual Load | ssj_ops | |
|---|---|---|---|
| Target | Actual | ||
| Calibration 1 | 82,846 | ||
| Calibration 2 | 88,666 | ||
| Calibration 3 | 89,275 | ||
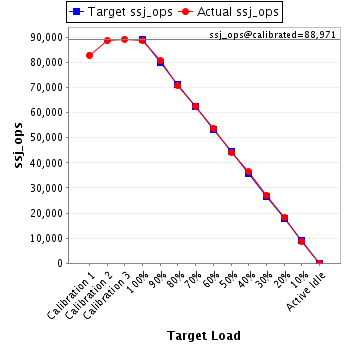
| ssj_ops@calibrated=88,971 | |||
| 100% | 99.8% | 88,971 | 88,777 |
| 90% | 90.7% | 80,073 | 80,668 |
| 80% | 79.7% | 71,176 | 70,919 |
| 70% | 70.4% | 62,279 | 62,604 |
| 60% | 60.4% | 53,382 | 53,744 |
| 50% | 49.6% | 44,485 | 44,168 |
| 40% | 40.9% | 35,588 | 36,376 |
| 30% | 30.3% | 26,691 | 26,997 |
| 20% | 20.3% | 17,794 | 18,053 |
| 10% | 9.9% | 8,897 | 8,833 |
| Active Idle | 0 | 0 | |
| Target Load | Actual Load | ssj_ops | |
|---|---|---|---|
| Target | Actual | ||
| Calibration 1 | 81,806 | ||
| Calibration 2 | 87,150 | ||
| Calibration 3 | 87,030 | ||
| ssj_ops@calibrated=87,090 | |||
| 100% | 100.1% | 87,090 | 87,162 |
| 90% | 90.8% | 78,381 | 79,062 |
| 80% | 79.4% | 69,672 | 69,176 |
| 70% | 70.8% | 60,963 | 61,682 |
| 60% | 60.8% | 52,254 | 52,925 |
| 50% | 49.1% | 43,545 | 42,735 |
| 40% | 40.1% | 34,836 | 34,927 |
| 30% | 30.2% | 26,127 | 26,313 |
| 20% | 20.3% | 17,418 | 17,637 |
| 10% | 9.9% | 8,709 | 8,662 |
| Active Idle | 0 | 0 | |

| Target Load | Actual Load | ssj_ops | |
|---|---|---|---|
| Target | Actual | ||
| Calibration 1 | 83,843 | ||
| Calibration 2 | 89,083 | ||
| Calibration 3 | 89,061 | ||
| ssj_ops@calibrated=89,072 | |||
| 100% | 99.9% | 89,072 | 88,943 |
| 90% | 90.6% | 80,165 | 80,657 |
| 80% | 79.5% | 71,258 | 70,802 |
| 70% | 69.5% | 62,351 | 61,916 |
| 60% | 58.5% | 53,443 | 52,142 |
| 50% | 50.4% | 44,536 | 44,877 |
| 40% | 39.8% | 35,629 | 35,441 |
| 30% | 30.0% | 26,722 | 26,698 |
| 20% | 20.3% | 17,814 | 18,050 |
| 10% | 9.7% | 8,907 | 8,600 |
| Active Idle | 0 | 0 | |

| Target Load | Actual Load | ssj_ops | |
|---|---|---|---|
| Target | Actual | ||
| Calibration 1 | 82,110 | ||
| Calibration 2 | 86,949 | ||
| Calibration 3 | 87,057 | ||
| ssj_ops@calibrated=87,003 | |||
| 100% | 99.6% | 87,003 | 86,664 |
| 90% | 89.8% | 78,303 | 78,150 |
| 80% | 80.5% | 69,603 | 70,065 |
| 70% | 69.9% | 60,902 | 60,813 |
| 60% | 59.8% | 52,202 | 52,057 |
| 50% | 50.0% | 43,502 | 43,528 |
| 40% | 40.8% | 34,801 | 35,468 |
| 30% | 30.2% | 26,101 | 26,283 |
| 20% | 20.2% | 17,401 | 17,582 |
| 10% | 10.2% | 8,700 | 8,846 |
| Active Idle | 0 | 0 | |

| Target Load | Actual Load | ssj_ops | |
|---|---|---|---|
| Target | Actual | ||
| Calibration 1 | 82,478 | ||
| Calibration 2 | 87,827 | ||
| Calibration 3 | 89,177 | ||
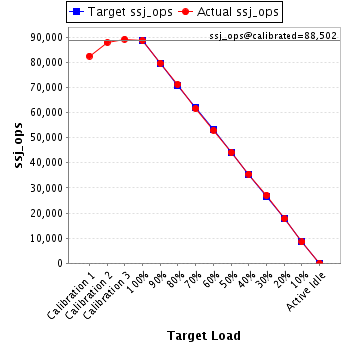
| ssj_ops@calibrated=88,502 | |||
| 100% | 100.2% | 88,502 | 88,710 |
| 90% | 90.0% | 79,652 | 79,630 |
| 80% | 80.4% | 70,802 | 71,179 |
| 70% | 69.6% | 61,951 | 61,611 |
| 60% | 59.9% | 53,101 | 52,976 |
| 50% | 49.9% | 44,251 | 44,143 |
| 40% | 40.1% | 35,401 | 35,510 |
| 30% | 30.6% | 26,551 | 27,094 |
| 20% | 20.0% | 17,700 | 17,721 |
| 10% | 9.6% | 8,850 | 8,479 |
| Active Idle | 0 | 0 | |
| Target Load | Actual Load | ssj_ops | |
|---|---|---|---|
| Target | Actual | ||
| Calibration 1 | 82,435 | ||
| Calibration 2 | 88,018 | ||
| Calibration 3 | 88,196 | ||
| ssj_ops@calibrated=88,107 | |||
| 100% | 100.6% | 88,107 | 88,625 |
| 90% | 90.4% | 79,297 | 79,653 |
| 80% | 78.3% | 70,486 | 68,957 |
| 70% | 69.7% | 61,675 | 61,445 |
| 60% | 60.2% | 52,864 | 53,052 |
| 50% | 50.2% | 44,054 | 44,244 |
| 40% | 39.6% | 35,243 | 34,913 |
| 30% | 30.6% | 26,432 | 26,994 |
| 20% | 19.3% | 17,621 | 16,972 |
| 10% | 10.2% | 8,811 | 8,945 |
| Active Idle | 0 | 0 | |

| Target Load | Actual Load | ssj_ops | |
|---|---|---|---|
| Target | Actual | ||
| Calibration 1 | 83,745 | ||
| Calibration 2 | 89,316 | ||
| Calibration 3 | 89,578 | ||
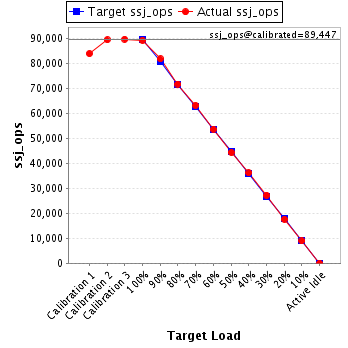
| ssj_ops@calibrated=89,447 | |||
| 100% | 99.7% | 89,447 | 89,160 |
| 90% | 91.3% | 80,502 | 81,684 |
| 80% | 80.1% | 71,557 | 71,644 |
| 70% | 70.5% | 62,613 | 63,103 |
| 60% | 60.0% | 53,668 | 53,638 |
| 50% | 49.5% | 44,723 | 44,283 |
| 40% | 40.3% | 35,779 | 36,086 |
| 30% | 30.4% | 26,834 | 27,216 |
| 20% | 19.7% | 17,889 | 17,617 |
| 10% | 10.0% | 8,945 | 8,925 |
| Active Idle | 0 | 0 | |
| Target Load | Actual Load | ssj_ops | |
|---|---|---|---|
| Target | Actual | ||
| Calibration 1 | 78,540 | ||
| Calibration 2 | 83,432 | ||
| Calibration 3 | 82,880 | ||
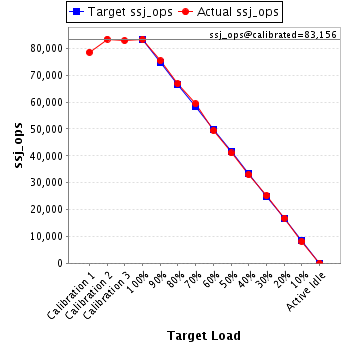
| ssj_ops@calibrated=83,156 | |||
| 100% | 100.3% | 83,156 | 83,392 |
| 90% | 90.7% | 74,840 | 75,404 |
| 80% | 80.4% | 66,525 | 66,856 |
| 70% | 71.4% | 58,209 | 59,350 |
| 60% | 59.4% | 49,894 | 49,421 |
| 50% | 49.4% | 41,578 | 41,056 |
| 40% | 39.6% | 33,262 | 32,936 |
| 30% | 30.2% | 24,947 | 25,139 |
| 20% | 20.2% | 16,631 | 16,804 |
| 10% | 9.7% | 8,316 | 8,104 |
| Active Idle | 0 | 0 | |
| Target Load | Actual Load | ssj_ops | |
|---|---|---|---|
| Target | Actual | ||
| Calibration 1 | 82,572 | ||
| Calibration 2 | 87,949 | ||
| Calibration 3 | 88,065 | ||
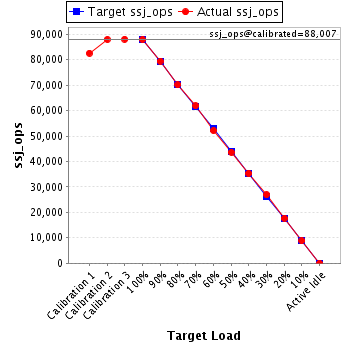
| ssj_ops@calibrated=88,007 | |||
| 100% | 99.9% | 88,007 | 87,918 |
| 90% | 90.3% | 79,206 | 79,471 |
| 80% | 79.6% | 70,405 | 70,086 |
| 70% | 70.3% | 61,605 | 61,828 |
| 60% | 59.3% | 52,804 | 52,165 |
| 50% | 49.6% | 44,003 | 43,630 |
| 40% | 40.1% | 35,203 | 35,319 |
| 30% | 30.6% | 26,402 | 26,922 |
| 20% | 20.1% | 17,601 | 17,721 |
| 10% | 10.1% | 8,801 | 8,857 |
| Active Idle | 0 | 0 | |
| Target Load | Actual Load | ssj_ops | |
|---|---|---|---|
| Target | Actual | ||
| Calibration 1 | 83,212 | ||
| Calibration 2 | 87,769 | ||
| Calibration 3 | 87,829 | ||
| ssj_ops@calibrated=87,799 | |||
| 100% | 99.5% | 87,799 | 87,351 |
| 90% | 89.7% | 79,019 | 78,792 |
| 80% | 80.1% | 70,239 | 70,341 |
| 70% | 69.5% | 61,459 | 61,029 |
| 60% | 59.7% | 52,679 | 52,390 |
| 50% | 49.9% | 43,899 | 43,786 |
| 40% | 40.1% | 35,120 | 35,191 |
| 30% | 30.3% | 26,340 | 26,599 |
| 20% | 19.9% | 17,560 | 17,465 |
| 10% | 10.0% | 8,780 | 8,745 |
| Active Idle | 0 | 0 | |

| Target Load | Actual Load | ssj_ops | |
|---|---|---|---|
| Target | Actual | ||
| Calibration 1 | 82,940 | ||
| Calibration 2 | 88,058 | ||
| Calibration 3 | 88,627 | ||
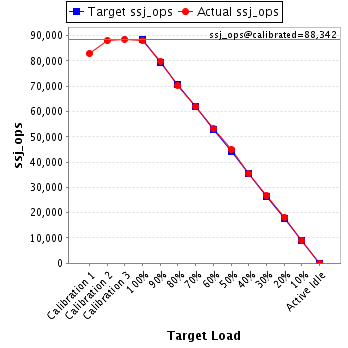
| ssj_ops@calibrated=88,342 | |||
| 100% | 99.7% | 88,342 | 88,057 |
| 90% | 90.3% | 79,508 | 79,789 |
| 80% | 79.7% | 70,674 | 70,423 |
| 70% | 70.2% | 61,840 | 61,997 |
| 60% | 60.1% | 53,005 | 53,114 |
| 50% | 50.9% | 44,171 | 44,937 |
| 40% | 40.2% | 35,337 | 35,505 |
| 30% | 30.2% | 26,503 | 26,641 |
| 20% | 20.5% | 17,668 | 18,078 |
| 10% | 10.2% | 8,834 | 8,982 |
| Active Idle | 0 | 0 | |
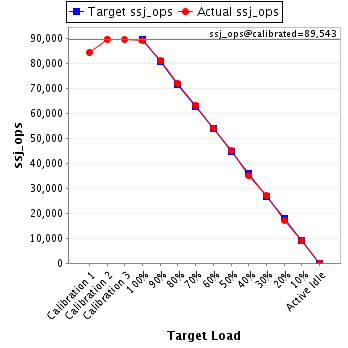
| Target Load | Actual Load | ssj_ops | |
|---|---|---|---|
| Target | Actual | ||
| Calibration 1 | 84,245 | ||
| Calibration 2 | 89,603 | ||
| Calibration 3 | 89,483 | ||
| ssj_ops@calibrated=89,543 | |||
| 100% | 99.4% | 89,543 | 89,046 |
| 90% | 90.4% | 80,589 | 80,958 |
| 80% | 80.4% | 71,635 | 71,996 |
| 70% | 70.6% | 62,680 | 63,232 |
| 60% | 60.3% | 53,726 | 54,023 |
| 50% | 50.2% | 44,772 | 44,962 |
| 40% | 39.0% | 35,817 | 34,966 |
| 30% | 30.1% | 26,863 | 26,990 |
| 20% | 19.3% | 17,909 | 17,279 |
| 10% | 10.0% | 8,954 | 8,954 |
| Active Idle | 0 | 0 | |
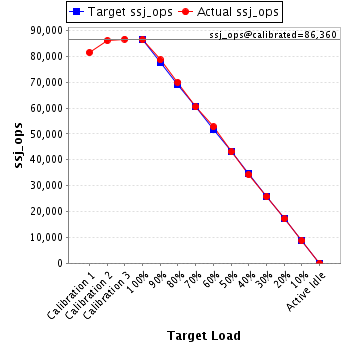
| Target Load | Actual Load | ssj_ops | |
|---|---|---|---|
| Target | Actual | ||
| Calibration 1 | 81,421 | ||
| Calibration 2 | 86,086 | ||
| Calibration 3 | 86,634 | ||
| ssj_ops@calibrated=86,360 | |||
| 100% | 100.0% | 86,360 | 86,403 |
| 90% | 91.0% | 77,724 | 78,615 |
| 80% | 81.0% | 69,088 | 69,946 |
| 70% | 70.0% | 60,452 | 60,462 |
| 60% | 61.1% | 51,816 | 52,763 |
| 50% | 49.9% | 43,180 | 43,113 |
| 40% | 39.6% | 34,544 | 34,235 |
| 30% | 29.8% | 25,908 | 25,709 |
| 20% | 19.9% | 17,272 | 17,184 |
| 10% | 10.1% | 8,636 | 8,758 |
| Active Idle | 0 | 0 | |
| Target Load | Actual Load | ssj_ops | |
|---|---|---|---|
| Target | Actual | ||
| Calibration 1 | 81,680 | ||
| Calibration 2 | 86,042 | ||
| Calibration 3 | 86,763 | ||
| ssj_ops@calibrated=86,402 | |||
| 100% | 99.7% | 86,402 | 86,150 |
| 90% | 90.0% | 77,762 | 77,783 |
| 80% | 79.5% | 69,122 | 68,651 |
| 70% | 69.9% | 60,482 | 60,415 |
| 60% | 60.7% | 51,841 | 52,424 |
| 50% | 50.1% | 43,201 | 43,283 |
| 40% | 39.7% | 34,561 | 34,301 |
| 30% | 29.8% | 25,921 | 25,743 |
| 20% | 19.4% | 17,280 | 16,757 |
| 10% | 9.6% | 8,640 | 8,337 |
| Active Idle | 0 | 0 | |

| Target Load | Actual Load | ssj_ops | |
|---|---|---|---|
| Target | Actual | ||
| Calibration 1 | 82,934 | ||
| Calibration 2 | 88,379 | ||
| Calibration 3 | 88,984 | ||
| ssj_ops@calibrated=88,682 | |||
| 100% | 100.1% | 88,682 | 88,744 |
| 90% | 89.0% | 79,813 | 78,920 |
| 80% | 80.3% | 70,945 | 71,246 |
| 70% | 69.8% | 62,077 | 61,886 |
| 60% | 59.2% | 53,209 | 52,525 |
| 50% | 49.8% | 44,341 | 44,184 |
| 40% | 39.7% | 35,473 | 35,205 |
| 30% | 30.0% | 26,604 | 26,634 |
| 20% | 20.2% | 17,736 | 17,895 |
| 10% | 9.9% | 8,868 | 8,787 |
| Active Idle | 0 | 0 | |

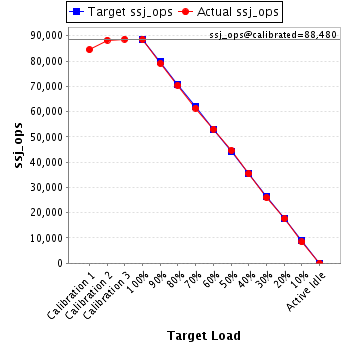
| Target Load | Actual Load | ssj_ops | |
|---|---|---|---|
| Target | Actual | ||
| Calibration 1 | 84,455 | ||
| Calibration 2 | 88,294 | ||
| Calibration 3 | 88,666 | ||
| ssj_ops@calibrated=88,480 | |||
| 100% | 100.0% | 88,480 | 88,510 |
| 90% | 89.3% | 79,632 | 79,037 |
| 80% | 79.6% | 70,784 | 70,401 |
| 70% | 69.4% | 61,936 | 61,372 |
| 60% | 60.0% | 53,088 | 53,052 |
| 50% | 50.5% | 44,240 | 44,671 |
| 40% | 40.0% | 35,392 | 35,420 |
| 30% | 29.4% | 26,544 | 25,971 |
| 20% | 19.9% | 17,696 | 17,641 |
| 10% | 9.5% | 8,848 | 8,433 |
| Active Idle | 0 | 0 | |
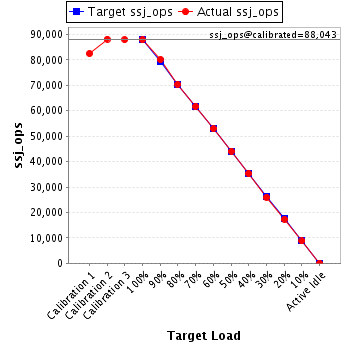
| Target Load | Actual Load | ssj_ops | |
|---|---|---|---|
| Target | Actual | ||
| Calibration 1 | 82,468 | ||
| Calibration 2 | 88,161 | ||
| Calibration 3 | 87,924 | ||
| ssj_ops@calibrated=88,043 | |||
| 100% | 99.8% | 88,043 | 87,904 |
| 90% | 91.0% | 79,238 | 80,153 |
| 80% | 79.9% | 70,434 | 70,380 |
| 70% | 70.2% | 61,630 | 61,773 |
| 60% | 60.1% | 52,826 | 52,917 |
| 50% | 50.1% | 44,021 | 44,072 |
| 40% | 40.0% | 35,217 | 35,249 |
| 30% | 29.5% | 26,413 | 25,969 |
| 20% | 19.6% | 17,609 | 17,299 |
| 10% | 10.0% | 8,804 | 8,770 |
| Active Idle | 0 | 0 | |
| Target Load | Actual Load | ssj_ops | |
|---|---|---|---|
| Target | Actual | ||
| Calibration 1 | 81,778 | ||
| Calibration 2 | 87,495 | ||
| Calibration 3 | 87,626 | ||
| ssj_ops@calibrated=87,560 | |||
| 100% | 100.6% | 87,560 | 88,079 |
| 90% | 90.3% | 78,804 | 79,045 |
| 80% | 80.0% | 70,048 | 70,036 |
| 70% | 69.2% | 61,292 | 60,602 |
| 60% | 59.0% | 52,536 | 51,699 |
| 50% | 49.9% | 43,780 | 43,653 |
| 40% | 39.8% | 35,024 | 34,871 |
| 30% | 30.4% | 26,268 | 26,608 |
| 20% | 19.7% | 17,512 | 17,257 |
| 10% | 9.8% | 8,756 | 8,587 |
| Active Idle | 0 | 0 | |

| Target Load | Actual Load | ssj_ops | |
|---|---|---|---|
| Target | Actual | ||
| Calibration 1 | 82,850 | ||
| Calibration 2 | 89,163 | ||
| Calibration 3 | 89,929 | ||
| ssj_ops@calibrated=89,546 | |||
| 100% | 99.9% | 89,546 | 89,417 |
| 90% | 89.8% | 80,592 | 80,409 |
| 80% | 78.3% | 71,637 | 70,101 |
| 70% | 69.5% | 62,682 | 62,276 |
| 60% | 60.6% | 53,728 | 54,249 |
| 50% | 50.4% | 44,773 | 45,093 |
| 40% | 40.0% | 35,819 | 35,840 |
| 30% | 30.2% | 26,864 | 27,024 |
| 20% | 19.8% | 17,909 | 17,707 |
| 10% | 9.8% | 8,955 | 8,808 |
| Active Idle | 0 | 0 | |

| Target Load | Actual Load | ssj_ops | |
|---|---|---|---|
| Target | Actual | ||
| Calibration 1 | 82,542 | ||
| Calibration 2 | 87,492 | ||
| Calibration 3 | 88,138 | ||
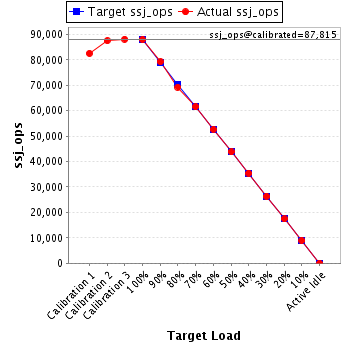
| ssj_ops@calibrated=87,815 | |||
| 100% | 100.2% | 87,815 | 88,026 |
| 90% | 90.2% | 79,033 | 79,242 |
| 80% | 78.9% | 70,252 | 69,274 |
| 70% | 70.1% | 61,470 | 61,555 |
| 60% | 60.0% | 52,689 | 52,699 |
| 50% | 49.9% | 43,907 | 43,790 |
| 40% | 40.4% | 35,126 | 35,440 |
| 30% | 30.1% | 26,344 | 26,394 |
| 20% | 19.9% | 17,563 | 17,432 |
| 10% | 10.2% | 8,781 | 8,941 |
| Active Idle | 0 | 0 | |
| Target Load | Actual Load | ssj_ops | |
|---|---|---|---|
| Target | Actual | ||
| Calibration 1 | 83,762 | ||
| Calibration 2 | 88,338 | ||
| Calibration 3 | 89,192 | ||
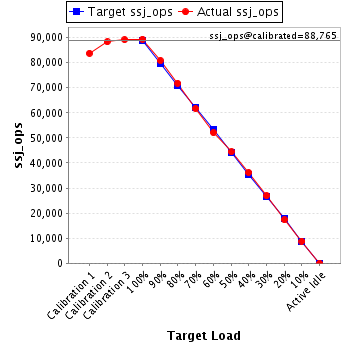
| ssj_ops@calibrated=88,765 | |||
| 100% | 100.7% | 88,765 | 89,402 |
| 90% | 91.2% | 79,888 | 80,913 |
| 80% | 80.9% | 71,012 | 71,805 |
| 70% | 69.6% | 62,135 | 61,738 |
| 60% | 58.7% | 53,259 | 52,086 |
| 50% | 50.1% | 44,382 | 44,436 |
| 40% | 40.8% | 35,506 | 36,182 |
| 30% | 30.3% | 26,629 | 26,914 |
| 20% | 19.5% | 17,753 | 17,300 |
| 10% | 9.9% | 8,876 | 8,800 |
| Active Idle | 0 | 0 | |