
SPECpower_ssj2008
JVM Instance 'WIN-S5D1BAVP3PA.010' Performance Report
Copyright © 2007-2014 Standard Performance Evaluation Corporation
| Quanta Computer Inc. QuantaGrid D51B-2U | ssj_ops@100% = 88,031 | ||||
| Test Sponsor: | Quanta Computer Inc. | SPEC License #: | 9050 | Test Method: | Single Node |
| Tested By: | Quanta Computer Inc. | Test Location: | Taoyuan, TW, R.O.C | Test Date: | Nov 22, 2014 |
| Hardware Availability: | Sep-2014 | Software Availability: | Jun-2013 | Publication: | Dec 10, 2014 |
| System Source: | Single Supplier | System Designation: | Server | Power Provisioning: | Line-powered |
| Target Load | Actual Load | ssj_ops | |
|---|---|---|---|
| Target | Actual | ||
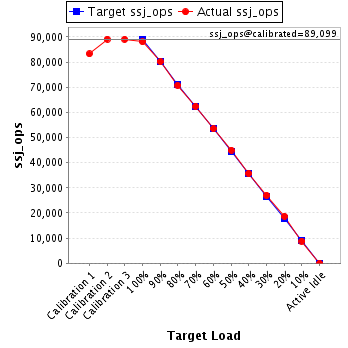
| Calibration 1 | 83,236 | ||
| Calibration 2 | 89,124 | ||
| Calibration 3 | 89,074 | ||
| ssj_ops@calibrated=89,099 | |||
| 100% | 98.8% | 89,099 | 88,031 |
| 90% | 90.0% | 80,189 | 80,177 |
| 80% | 79.4% | 71,279 | 70,740 |
| 70% | 70.1% | 62,369 | 62,481 |
| 60% | 60.0% | 53,459 | 53,488 |
| 50% | 50.5% | 44,550 | 45,000 |
| 40% | 40.1% | 35,640 | 35,706 |
| 30% | 30.3% | 26,730 | 27,030 |
| 20% | 21.0% | 17,820 | 18,711 |
| 10% | 9.9% | 8,910 | 8,800 |
| Active Idle | 0 | 0 | |
| Set Identifier: | S2B |
| Set Description: | System Under Test |
| # of Identical Nodes: | 1 |
| Comment: | None |
| Hardware | |
|---|---|
| Hardware Vendor: | Quanta Computer Inc. |
| Model: | QuantaGrid D51B-2U |
| Form Factor: | 2U |
| CPU Name: | Intel Xeon E5-2699 v3 2.30 GHz |
| CPU Characteristics: | 18 core, 2.3GHz, 45MB L3 Cache |
| CPU Frequency (MHz): | 2300 |
| CPU(s) Enabled: | 36 cores, 2 chips, 18 cores/chip |
| Hardware Threads: | 72 (2 / core) |
| CPU(s) Orderable: | 1,2 chips |
| Primary Cache: | 32 KB I + 32 KB D on chip per core |
| Secondary Cache: | 256 KB I+D on chip per chip |
| Tertiary Cache: | 45 MB I+D off chip per chip |
| Other Cache: | None |
| Memory Amount (GB): | 64 |
| # and size of DIMM: | 8 x 8192 MB |
| Memory Details: | 8GB 2Rx8 PC4-2133P-RE0-10; slots A0, B0, C0, D0, E0, F0, G0 ,H0 populated |
| Power Supply Quantity and Rating (W): | 1 x 500 |
| Power Supply Details: | Quanta P/N AF500B00028 |
| Disk Drive: | 1 x 960G SATA SSD,Quanta P/N ABSAK960000 |
| Disk Controller: | Integrated SATA controller |
| # and type of Network Interface Cards (NICs) Installed: | 1 x Intel Ethernet Controller I350, 2-port |
| NICs Enabled in Firmware / OS / Connected: | 2/2/1 |
| Network Speed (Mbit): | 1000 |
| Keyboard: | None |
| Mouse: | None |
| Monitor: | None |
| Optical Drives: | No |
| Other Hardware: | None |
| Software | |
|---|---|
| Power Management: | Balanced power plan in OS |
| Operating System (OS): | Microsoft Windows Server 2008 R2 Enterprise with SP1 |
| OS Version: | Version 6.1.7601 Service Pack 1 Build 7601 |
| Filesystem: | NTFS |
| JVM Vendor: | IBM Corporation |
| JVM Version: | IBM J9 VM (build 2.6, JRE 1.7.0 Windows Server 2008 R2 amd64-64 20120322_106209 (JIT enabled, AOT enabled) |
| JVM Command-line Options: | -Xmn825m -Xms975m -Xmx975m -Xaggressive -Xcompressedrefs -Xgcpolicy:gencon -XlockReservation -Xnoloa -XtlhPrefetch -Xlp -Xconcurrentlevel0 -Xthr:minimizeusercpu -Xgcthreads2 (-Xgcthreads1 for JVM5 and JVM23) |
| JVM Affinity: | start /NODE [0,1,2,3] /AFFINITY [0x3,0xC,0x30,0xC0,0x300,0xC00,0x3000,0xC000,0x30000] |
| JVM Instances: | 36 |
| JVM Initial Heap (MB): | 975 |
| JVM Maximum Heap (MB): | 975 |
| JVM Address Bits: | 64 |
| Boot Firmware Version: | 3A08 |
| Management Firmware Version: | 3.07 |
| Workload Version: | SSJ 1.2.10 |
| Director Location: | Controller |
| Other Software: | IBM WebSphere Application Server V8.5.0.0, Microsoft Hotfix for Windows (KB2510206) |
| Target Load | Actual Load | Transaction Type | Count | Total Heap (MB) |
|---|---|---|---|---|
| Calibration 1 | New Order | 6,055,393 | 975 | |
| Payment | 6,055,394 | |||
| Order Status | 605,539 | |||
| Delivery | 605,540 | |||
| Stock Level | 605,540 | |||
| Customer Report | 6,055,395 | |||
| Calibration 2 | New Order | 6,482,143 | 975 | |
| Payment | 6,482,143 | |||
| Order Status | 648,216 | |||
| Delivery | 648,215 | |||
| Stock Level | 648,215 | |||
| Customer Report | 6,482,147 | |||
| Calibration 3 | New Order | 6,482,719 | 975 | |
| Payment | 6,482,710 | |||
| Order Status | 648,272 | |||
| Delivery | 648,271 | |||
| Stock Level | 648,272 | |||
| Customer Report | 6,482,712 | |||
| 100% | 98.8% | New Order | 6,402,622 | 975 |
| Payment | 6,402,616 | |||
| Order Status | 640,263 | |||
| Delivery | 640,263 | |||
| Stock Level | 640,262 | |||
| Customer Report | 6,402,617 | |||
| 90% | 90.0% | New Order | 5,831,402 | 975 |
| Payment | 5,831,398 | |||
| Order Status | 583,141 | |||
| Delivery | 583,142 | |||
| Stock Level | 583,141 | |||
| Customer Report | 5,831,395 | |||
| 80% | 79.4% | New Order | 5,145,009 | 975 |
| Payment | 5,145,004 | |||
| Order Status | 514,501 | |||
| Delivery | 514,501 | |||
| Stock Level | 514,500 | |||
| Customer Report | 5,145,011 | |||
| 70% | 70.1% | New Order | 4,544,336 | 975 |
| Payment | 4,544,336 | |||
| Order Status | 454,434 | |||
| Delivery | 454,434 | |||
| Stock Level | 454,433 | |||
| Customer Report | 4,544,333 | |||
| 60% | 60.0% | New Order | 3,890,208 | 975 |
| Payment | 3,890,205 | |||
| Order Status | 389,021 | |||
| Delivery | 389,021 | |||
| Stock Level | 389,020 | |||
| Customer Report | 3,890,212 | |||
| 50% | 50.5% | New Order | 3,272,880 | 975 |
| Payment | 3,272,874 | |||
| Order Status | 327,288 | |||
| Delivery | 327,287 | |||
| Stock Level | 327,287 | |||
| Customer Report | 3,272,878 | |||
| 40% | 40.1% | New Order | 2,596,924 | 975 |
| Payment | 2,596,925 | |||
| Order Status | 259,692 | |||
| Delivery | 259,692 | |||
| Stock Level | 259,692 | |||
| Customer Report | 2,596,924 | |||
| 30% | 30.3% | New Order | 1,965,926 | 975 |
| Payment | 1,965,930 | |||
| Order Status | 196,594 | |||
| Delivery | 196,592 | |||
| Stock Level | 196,594 | |||
| Customer Report | 1,965,934 | |||
| 20% | 21.0% | New Order | 1,360,911 | 975 |
| Payment | 1,360,907 | |||
| Order Status | 136,092 | |||
| Delivery | 136,090 | |||
| Stock Level | 136,092 | |||
| Customer Report | 1,360,908 | |||
| 10% | 9.9% | New Order | 640,053 | 975 |
| Payment | 640,048 | |||
| Order Status | 64,005 | |||
| Delivery | 64,005 | |||
| Stock Level | 64,005 | |||
| Customer Report | 640,056 | |||
| Active Idle | New Order | 0 | 975 | |
| Payment | 0 | |||
| Order Status | 0 | |||
| Delivery | 0 | |||
| Stock Level | 0 | |||
| Customer Report | 0 | |||