SPECpower_ssj2008
Host 'WIN-6CL781RHVI7' Performance Report
Copyright © 2007-2013 Standard Performance Evaluation Corporation
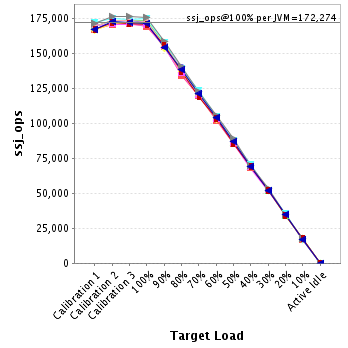
| Huawei Technologies Co., Ltd Tecal CH121 | ssj_ops@100% = 1,722,741 ssj_ops@100% per JVM = 172,274 |
||||
| Test Sponsor: | Huawei Technologies Co., Ltd | SPEC License #: | 3175 | Test Method: | Multi Node |
| Tested By: | Huawei Technologies Co., Ltd | Test Location: | Shenzhen, Guangdong, China | Test Date: | Sep 6, 2013 |
| Hardware Availability: | Sep-2013 | Software Availability: | Jan-2012 | Publication: | Oct 21, 2013 |
| System Source: | Single Supplier | System Designation: | Server | Power Provisioning: | Line-powered |
| Target Load | Actual Load | ssj_ops | |
|---|---|---|---|
| Target | Actual | ||
| Calibration 1 | 1,691,315 | ||
| Calibration 2 | 1,729,942 | ||
| Calibration 3 | 1,731,200 | ||
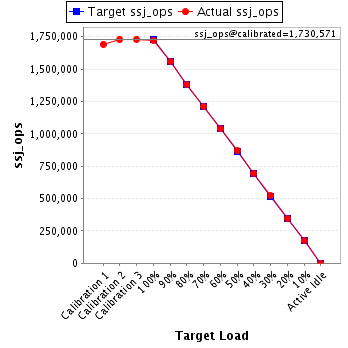
| ssj_ops@calibrated=1,730,571 | |||
| 100% | 99.5% | 1,730,571 | 1,722,741 |
| 90% | 90.0% | 1,557,514 | 1,557,340 |
| 80% | 79.8% | 1,384,457 | 1,380,585 |
| 70% | 70.0% | 1,211,400 | 1,211,538 |
| 60% | 60.0% | 1,038,343 | 1,038,306 |
| 50% | 50.1% | 865,286 | 867,812 |
| 40% | 40.1% | 692,229 | 694,253 |
| 30% | 30.1% | 519,171 | 521,036 |
| 20% | 20.0% | 346,114 | 346,462 |
| 10% | 10.0% | 173,057 | 172,492 |
| Active Idle | 0 | 0 | |
| Set Identifier: | sut |
| Set Description: | System Under Test |
| # of Identical Nodes: | 8 |
| Comment: | None |
| Hardware | |
|---|---|
| Hardware Vendor: | Huawei Technologies Co., Ltd |
| Model: | Tecal CH121 |
| Form Factor: | Blade |
| CPU Name: | Intel Xeon E5-2660 v2 |
| CPU Characteristics: | 10-Core, 2.2GHz, 25MB L3 Cache (Intel Turbo Boost Technology up to 3.0GHz) |
| CPU Frequency (MHz): | 2200 |
| CPU(s) Enabled: | 20 cores, 2 chips, 10 cores/chip |
| Hardware Threads: | 40 (2 / core) |
| CPU(s) Orderable: | 1,2 chips |
| Primary Cache: | 32 KB I + 32 KB D on chip per core |
| Secondary Cache: | 256 KB I+D on chip per core |
| Tertiary Cache: | 25 MB I+D on chip per chip |
| Other Cache: | None |
| Memory Amount (GB): | 24 |
| # and size of DIMM: | 6 x 4 GB |
| Memory Details: | 4GB 2Rx8 PC3L-10600R ECC RDIMM,Slots 1A1 1B1, 1C1,2A1,2B1,2C1 populated |
| Power Supply Quantity and Rating (W): | None |
| Power Supply Details: | Shared |
| Disk Drive: | 1 x 240GB SSD 2.5" SATA Huawei P/N 02310MMT |
| Disk Controller: | Integrated SATA controller |
| # and type of Network Interface Cards (NICs) Installed: | 1 x Dual-port Intel 82580 Gigabit Ethernet controller |
| NICs Enabled in Firmware / OS / Connected: | 2/2/1 |
| Network Speed (Mbit): | 1000 |
| Keyboard: | None |
| Mouse: | None |
| Monitor: | None |
| Optical Drives: | No |
| Other Hardware: | None |
| Software | |
|---|---|
| Power Management: | Power Saver Mode enabled in OS |
| Operating System (OS): | Microsoft Windows Server 2008 Enterprise x64 Edition |
| OS Version: | R2 SP1 (64-bit) |
| Filesystem: | NTFS |
| JVM Vendor: | IBM Corporation |
| JVM Version: | IBM J9 VM (build 2.6,JRE 1.7.0 Windows Server 2008 R2 amd64-64 20120322_106209 (JIT enabled, AOT enabled) |
| JVM Command-line Options: | -Xaggressive -Xcompressedrefs -Xmx1875m -Xms1875m -Xmn1400m -XlockReservation -Xnoloa -XtlhPrefetch -Xlp -Xconcurrentlevel0 |
| JVM Affinity: | start /affinity [F,F0,F00,F000,F0000,F00000,F000000,F0000000,F00000000,F000000000] |
| JVM Instances: | 10 |
| JVM Initial Heap (MB): | 1875 |
| JVM Maximum Heap (MB): | 1500 |
| JVM Address Bits: | 64 |
| Boot Firmware Version: | V063 |
| Management Firmware Version: | 3.35 |
| Workload Version: | SSJ 1.2.10 |
| Director Location: | Controller |
| Other Software: | IBM SDK Java Technology Edition Version 7.0 for windows x64 |
| JVM Instance | ssj_ops@100% |
|---|---|
| WIN-6CL781RHVI7.001 | 169,386 |
| WIN-6CL781RHVI7.002 | 172,060 |
| WIN-6CL781RHVI7.003 | 173,486 |
| WIN-6CL781RHVI7.004 | 171,424 |
| WIN-6CL781RHVI7.005 | 170,003 |
| WIN-6CL781RHVI7.006 | 174,959 |
| WIN-6CL781RHVI7.007 | 172,982 |
| WIN-6CL781RHVI7.008 | 175,991 |
| WIN-6CL781RHVI7.009 | 170,611 |
| WIN-6CL781RHVI7.010 | 171,840 |
| ssj_ops@100% | 1,722,741 |
| ssj_ops@100% per JVM | 172,274 |
| Target Load | Actual Load | ssj_ops | |
|---|---|---|---|
| Target | Actual | ||
| Calibration 1 | 166,887 | ||
| Calibration 2 | 170,479 | ||
| Calibration 3 | 171,487 | ||
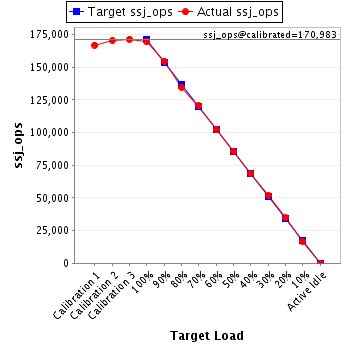
| ssj_ops@calibrated=170,983 | |||
| 100% | 99.1% | 170,983 | 169,386 |
| 90% | 90.5% | 153,885 | 154,728 |
| 80% | 78.8% | 136,787 | 134,660 |
| 70% | 70.4% | 119,688 | 120,344 |
| 60% | 59.7% | 102,590 | 102,160 |
| 50% | 50.2% | 85,492 | 85,855 |
| 40% | 40.2% | 68,393 | 68,790 |
| 30% | 30.4% | 51,295 | 51,950 |
| 20% | 20.3% | 34,197 | 34,661 |
| 10% | 9.9% | 17,098 | 16,919 |
| Active Idle | 0 | 0 | |
| Target Load | Actual Load | ssj_ops | |
|---|---|---|---|
| Target | Actual | ||
| Calibration 1 | 169,590 | ||
| Calibration 2 | 173,539 | ||
| Calibration 3 | 173,689 | ||
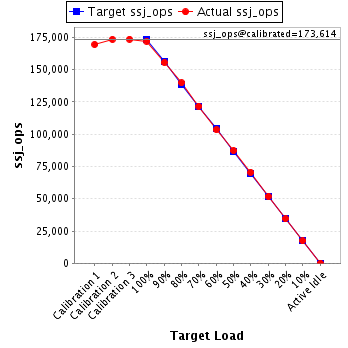
| ssj_ops@calibrated=173,614 | |||
| 100% | 99.1% | 173,614 | 172,060 |
| 90% | 89.7% | 156,252 | 155,653 |
| 80% | 80.5% | 138,891 | 139,803 |
| 70% | 70.1% | 121,530 | 121,730 |
| 60% | 59.6% | 104,168 | 103,478 |
| 50% | 50.3% | 86,807 | 87,305 |
| 40% | 40.6% | 69,446 | 70,516 |
| 30% | 29.9% | 52,084 | 51,878 |
| 20% | 19.8% | 34,723 | 34,395 |
| 10% | 10.0% | 17,361 | 17,395 |
| Active Idle | 0 | 0 | |
| Target Load | Actual Load | ssj_ops | |
|---|---|---|---|
| Target | Actual | ||
| Calibration 1 | 169,101 | ||
| Calibration 2 | 173,584 | ||
| Calibration 3 | 173,902 | ||
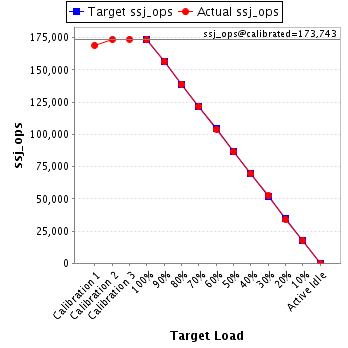
| ssj_ops@calibrated=173,743 | |||
| 100% | 99.9% | 173,743 | 173,486 |
| 90% | 90.0% | 156,369 | 156,444 |
| 80% | 80.0% | 138,994 | 138,950 |
| 70% | 70.1% | 121,620 | 121,748 |
| 60% | 59.9% | 104,246 | 104,090 |
| 50% | 49.7% | 86,871 | 86,357 |
| 40% | 39.9% | 69,497 | 69,387 |
| 30% | 30.1% | 52,123 | 52,246 |
| 20% | 19.7% | 34,749 | 34,151 |
| 10% | 10.1% | 17,374 | 17,489 |
| Active Idle | 0 | 0 | |
| Target Load | Actual Load | ssj_ops | |
|---|---|---|---|
| Target | Actual | ||
| Calibration 1 | 166,710 | ||
| Calibration 2 | 171,571 | ||
| Calibration 3 | 172,287 | ||
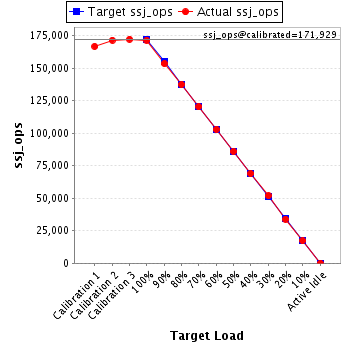
| ssj_ops@calibrated=171,929 | |||
| 100% | 99.7% | 171,929 | 171,424 |
| 90% | 89.3% | 154,736 | 153,469 |
| 80% | 79.9% | 137,543 | 137,452 |
| 70% | 70.0% | 120,350 | 120,323 |
| 60% | 59.9% | 103,157 | 102,987 |
| 50% | 50.1% | 85,964 | 86,138 |
| 40% | 40.1% | 68,772 | 68,960 |
| 30% | 30.2% | 51,579 | 51,930 |
| 20% | 19.7% | 34,386 | 33,949 |
| 10% | 10.1% | 17,193 | 17,295 |
| Active Idle | 0 | 0 | |
| Target Load | Actual Load | ssj_ops | |
|---|---|---|---|
| Target | Actual | ||
| Calibration 1 | 170,324 | ||
| Calibration 2 | 170,543 | ||
| Calibration 3 | 170,863 | ||
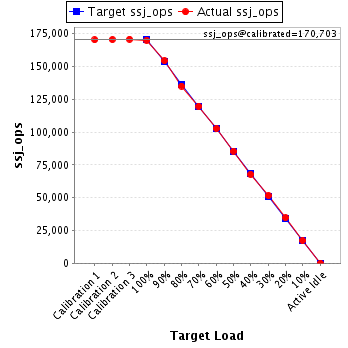
| ssj_ops@calibrated=170,703 | |||
| 100% | 99.6% | 170,703 | 170,003 |
| 90% | 90.4% | 153,633 | 154,396 |
| 80% | 79.2% | 136,562 | 135,138 |
| 70% | 70.1% | 119,492 | 119,713 |
| 60% | 60.2% | 102,422 | 102,724 |
| 50% | 50.1% | 85,351 | 85,549 |
| 40% | 39.7% | 68,281 | 67,803 |
| 30% | 30.2% | 51,211 | 51,616 |
| 20% | 20.3% | 34,141 | 34,571 |
| 10% | 10.1% | 17,070 | 17,309 |
| Active Idle | 0 | 0 | |
| Target Load | Actual Load | ssj_ops | |
|---|---|---|---|
| Target | Actual | ||
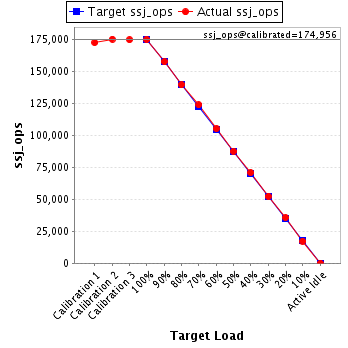
| Calibration 1 | 172,510 | ||
| Calibration 2 | 175,251 | ||
| Calibration 3 | 174,662 | ||
| ssj_ops@calibrated=174,956 | |||
| 100% | 100.0% | 174,956 | 174,959 |
| 90% | 90.1% | 157,461 | 157,618 |
| 80% | 79.7% | 139,965 | 139,525 |
| 70% | 70.8% | 122,469 | 123,854 |
| 60% | 60.2% | 104,974 | 105,253 |
| 50% | 50.1% | 87,478 | 87,685 |
| 40% | 40.5% | 69,983 | 70,915 |
| 30% | 29.9% | 52,487 | 52,374 |
| 20% | 20.4% | 34,991 | 35,684 |
| 10% | 9.9% | 17,496 | 17,266 |
| Active Idle | 0 | 0 | |
| Target Load | Actual Load | ssj_ops | |
|---|---|---|---|
| Target | Actual | ||
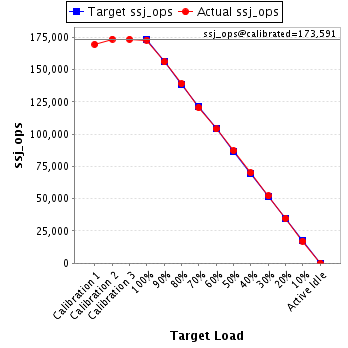
| Calibration 1 | 169,620 | ||
| Calibration 2 | 173,637 | ||
| Calibration 3 | 173,545 | ||
| ssj_ops@calibrated=173,591 | |||
| 100% | 99.6% | 173,591 | 172,982 |
| 90% | 89.9% | 156,232 | 156,023 |
| 80% | 80.1% | 138,873 | 139,117 |
| 70% | 69.5% | 121,514 | 120,574 |
| 60% | 60.0% | 104,155 | 104,074 |
| 50% | 50.2% | 86,796 | 87,194 |
| 40% | 40.3% | 69,437 | 70,014 |
| 30% | 30.0% | 52,077 | 52,118 |
| 20% | 20.0% | 34,718 | 34,775 |
| 10% | 9.9% | 17,359 | 17,149 |
| Active Idle | 0 | 0 | |
| Target Load | Actual Load | ssj_ops | |
|---|---|---|---|
| Target | Actual | ||
| Calibration 1 | 171,809 | ||
| Calibration 2 | 176,530 | ||
| Calibration 3 | 176,620 | ||
| ssj_ops@calibrated=176,575 | |||
| 100% | 99.7% | 176,575 | 175,991 |
| 90% | 90.0% | 158,917 | 158,855 |
| 80% | 79.6% | 141,260 | 140,569 |
| 70% | 69.6% | 123,602 | 122,861 |
| 60% | 60.0% | 105,945 | 105,985 |
| 50% | 50.4% | 88,287 | 88,930 |
| 40% | 39.5% | 70,630 | 69,743 |
| 30% | 30.2% | 52,972 | 53,267 |
| 20% | 19.9% | 35,315 | 35,070 |
| 10% | 9.9% | 17,657 | 17,396 |
| Active Idle | 0 | 0 | |

| Target Load | Actual Load | ssj_ops | |
|---|---|---|---|
| Target | Actual | ||
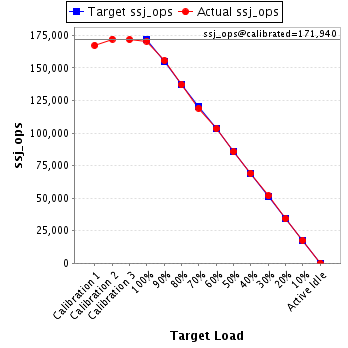
| Calibration 1 | 167,320 | ||
| Calibration 2 | 172,134 | ||
| Calibration 3 | 171,746 | ||
| ssj_ops@calibrated=171,940 | |||
| 100% | 99.2% | 171,940 | 170,611 |
| 90% | 90.6% | 154,746 | 155,701 |
| 80% | 79.7% | 137,552 | 137,066 |
| 70% | 69.3% | 120,358 | 119,104 |
| 60% | 60.2% | 103,164 | 103,457 |
| 50% | 49.8% | 85,970 | 85,632 |
| 40% | 40.1% | 68,776 | 69,006 |
| 30% | 30.1% | 51,582 | 51,773 |
| 20% | 19.9% | 34,388 | 34,229 |
| 10% | 10.2% | 17,194 | 17,562 |
| Active Idle | 0 | 0 | |
| Target Load | Actual Load | ssj_ops | |
|---|---|---|---|
| Target | Actual | ||
| Calibration 1 | 167,444 | ||
| Calibration 2 | 172,675 | ||
| Calibration 3 | 172,399 | ||
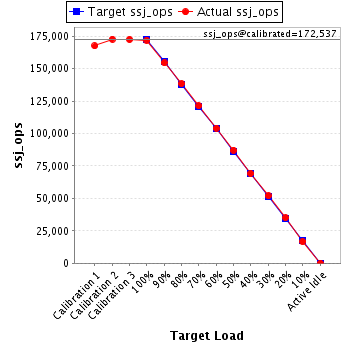
| ssj_ops@calibrated=172,537 | |||
| 100% | 99.6% | 172,537 | 171,840 |
| 90% | 89.5% | 155,283 | 154,453 |
| 80% | 80.2% | 138,030 | 138,303 |
| 70% | 70.3% | 120,776 | 121,287 |
| 60% | 60.3% | 103,522 | 104,097 |
| 50% | 50.5% | 86,269 | 87,166 |
| 40% | 40.1% | 69,015 | 69,119 |
| 30% | 30.1% | 51,761 | 51,883 |
| 20% | 20.3% | 34,507 | 34,976 |
| 10% | 9.7% | 17,254 | 16,711 |
| Active Idle | 0 | 0 | |