SPECpower_ssj2008
Host 'altosr380f2' Performance Report
Copyright © 2007-2013 Standard Performance Evaluation Corporation
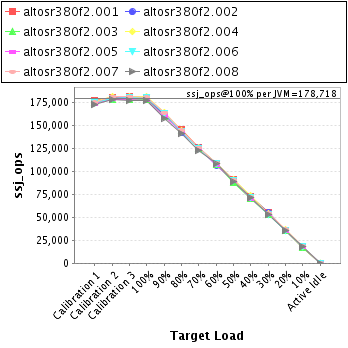
| Acer Incorporated Altos R360 F2 | ssj_ops@100% = 1,429,746 ssj_ops@100% per JVM = 178,718 |
||||
| Test Sponsor: | Acer Incorporated | SPEC License #: | 97 | Test Method: | Single Node |
| Tested By: | Acer Incorporated | Test Location: | Taipei, R.O.C. | Test Date: | Apr 9, 2013 |
| Hardware Availability: | May-2013 | Software Availability: | Oct-2012 | Publication: | May 8, 2013 |
| System Source: | Single Supplier | System Designation: | Server | Power Provisioning: | Line-powered |
| Target Load | Actual Load | ssj_ops | |
|---|---|---|---|
| Target | Actual | ||
| Calibration 1 | 1,395,015 | ||
| Calibration 2 | 1,432,965 | ||
| Calibration 3 | 1,434,792 | ||
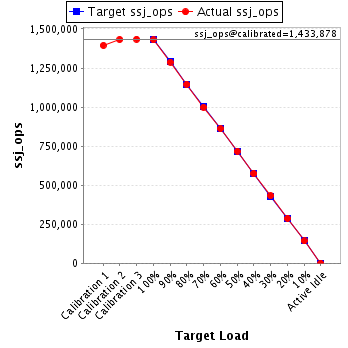
| ssj_ops@calibrated=1,433,878 | |||
| 100% | 99.7% | 1,433,878 | 1,429,746 |
| 90% | 89.8% | 1,290,490 | 1,287,902 |
| 80% | 79.9% | 1,147,103 | 1,145,690 |
| 70% | 69.7% | 1,003,715 | 999,996 |
| 60% | 60.0% | 860,327 | 860,924 |
| 50% | 50.0% | 716,939 | 717,140 |
| 40% | 40.0% | 573,551 | 573,562 |
| 30% | 30.1% | 430,163 | 431,702 |
| 20% | 20.0% | 286,776 | 286,995 |
| 10% | 10.0% | 143,388 | 142,821 |
| Active Idle | 0 | 0 | |
| Set Identifier: | sut |
| Set Description: | System Under Test |
| # of Identical Nodes: | 1 |
| Comment: | None |
| Hardware | |
|---|---|
| Hardware Vendor: | Acer Incorporated |
| Model: | Altos R360 F2 |
| Form Factor: | 1U |
| CPU Name: | Intel Xeon E5-2660 2.2 GHz (Intel Turbo Boost Technology up to 3.00 GHz) |
| CPU Characteristics: | 8 core, 2.20 GHz, 20MB L3 Cache |
| CPU Frequency (MHz): | 2200 |
| CPU(s) Enabled: | 16 cores, 2 chips, 8 cores/chip |
| Hardware Threads: | 32 (2 / core) |
| CPU(s) Orderable: | 1,2 chips |
| Primary Cache: | 32 KB I + 32 KB D on chip per core |
| Secondary Cache: | 256 KB I+D on chip per chip |
| Tertiary Cache: | 20 MB I+D on chip per chip |
| Other Cache: | None |
| Memory Amount (GB): | 24 |
| # and size of DIMM: | 6 x 4096 MB |
| Memory Details: | 4GB 2Rx4 PC3-10600R; slots A1, B1, C1, E1, F1 and G1 populated |
| Power Supply Quantity and Rating (W): | 1 x 750 |
| Power Supply Details: | Acer P/N SC.75017.002 |
| Disk Drive: | 1 x 1TB 7.2K RPM SATA 2.5" HDD, Acer Part #KH01K01.035 |
| Disk Controller: | onboard SCU controller |
| # and type of Network Interface Cards (NICs) Installed: | 2 x Intel I350 dual-port Gigabit Ethernet controller |
| NICs Enabled in Firmware / OS / Connected: | 1/1/1 |
| Network Speed (Mbit): | 1000 |
| Keyboard: | None |
| Mouse: | None |
| Monitor: | None |
| Optical Drives: | No |
| Other Hardware: | None |
| Software | |
|---|---|
| Power Management: | Power saver enabled in OS |
| Operating System (OS): | Windows Server 2008, Enterprise Edition |
| OS Version: | R2 SP1 |
| Filesystem: | NTFS |
| JVM Vendor: | IBM Corporation |
| JVM Version: | IBM J9 VM (build 2.6, JRE 1.7.0 Windows Server 2008 R2 amd64-64 20120322_106209 JIT enabled, AOT enabled) |
| JVM Command-line Options: | -Xaggressive -Xcompressedrefs -Xmx1500m -Xms1500m -Xmn1100m -XlockReservation -Xnoloa -XtlhPrefetch -Xlp -Xconcurrentlevel0 -Xthr:minimizeusercpu -Xgcthreads4 |
| JVM Affinity: | start /affinity [0F,F0,F00,F000,F0000,F00000,F000000,F0000000] |
| JVM Instances: | 8 |
| JVM Initial Heap (MB): | 1500 |
| JVM Maximum Heap (MB): | 1500 |
| JVM Address Bits: | 64 |
| Boot Firmware Version: | 01.06.0002 |
| Management Firmware Version: | 1.17.4151 |
| Workload Version: | SSJ 1.2.10 |
| Director Location: | Controller |
| Other Software: | IBM SDK Java Technology Edition Version 7.0 for Windows x64 |
| JVM Instance | ssj_ops@100% |
|---|---|
| altosr380f2.001 | 179,688 |
| altosr380f2.002 | 178,944 |
| altosr380f2.003 | 177,379 |
| altosr380f2.004 | 180,565 |
| altosr380f2.005 | 176,760 |
| altosr380f2.006 | 179,433 |
| altosr380f2.007 | 180,016 |
| altosr380f2.008 | 176,961 |
| ssj_ops@100% | 1,429,746 |
| ssj_ops@100% per JVM | 178,718 |
| Target Load | Actual Load | ssj_ops | |
|---|---|---|---|
| Target | Actual | ||
| Calibration 1 | 176,492 | ||
| Calibration 2 | 180,388 | ||
| Calibration 3 | 181,369 | ||
| ssj_ops@calibrated=180,878 | |||
| 100% | 99.3% | 180,878 | 179,688 |
| 90% | 88.7% | 162,790 | 160,516 |
| 80% | 80.0% | 144,703 | 144,680 |
| 70% | 69.7% | 126,615 | 126,067 |
| 60% | 59.8% | 108,527 | 108,126 |
| 50% | 50.2% | 90,439 | 90,811 |
| 40% | 39.8% | 72,351 | 72,068 |
| 30% | 30.6% | 54,263 | 55,425 |
| 20% | 19.7% | 36,176 | 35,620 |
| 10% | 9.7% | 18,088 | 17,616 |
| Active Idle | 0 | 0 | |

| Target Load | Actual Load | ssj_ops | |
|---|---|---|---|
| Target | Actual | ||
| Calibration 1 | 174,422 | ||
| Calibration 2 | 178,758 | ||
| Calibration 3 | 179,621 | ||
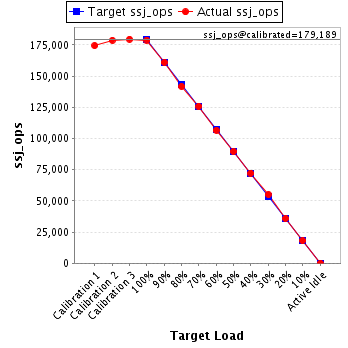
| ssj_ops@calibrated=179,189 | |||
| 100% | 99.9% | 179,189 | 178,944 |
| 90% | 89.9% | 161,270 | 161,085 |
| 80% | 79.1% | 143,351 | 141,792 |
| 70% | 70.3% | 125,432 | 125,900 |
| 60% | 59.5% | 107,513 | 106,599 |
| 50% | 50.1% | 89,595 | 89,698 |
| 40% | 40.4% | 71,676 | 72,308 |
| 30% | 30.7% | 53,757 | 55,098 |
| 20% | 20.1% | 35,838 | 36,016 |
| 10% | 10.1% | 17,919 | 18,144 |
| Active Idle | 0 | 0 | |
| Target Load | Actual Load | ssj_ops | |
|---|---|---|---|
| Target | Actual | ||
| Calibration 1 | 174,451 | ||
| Calibration 2 | 177,600 | ||
| Calibration 3 | 177,641 | ||
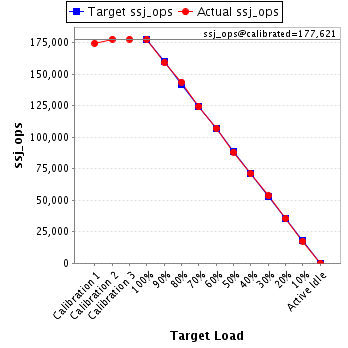
| ssj_ops@calibrated=177,621 | |||
| 100% | 99.9% | 177,621 | 177,379 |
| 90% | 89.5% | 159,859 | 159,050 |
| 80% | 80.9% | 142,097 | 143,643 |
| 70% | 69.9% | 124,334 | 124,239 |
| 60% | 60.3% | 106,572 | 107,158 |
| 50% | 49.6% | 88,810 | 88,152 |
| 40% | 39.9% | 71,048 | 70,824 |
| 30% | 30.1% | 53,286 | 53,403 |
| 20% | 20.1% | 35,524 | 35,624 |
| 10% | 9.9% | 17,762 | 17,550 |
| Active Idle | 0 | 0 | |
| Target Load | Actual Load | ssj_ops | |
|---|---|---|---|
| Target | Actual | ||
| Calibration 1 | 175,402 | ||
| Calibration 2 | 180,685 | ||
| Calibration 3 | 180,970 | ||
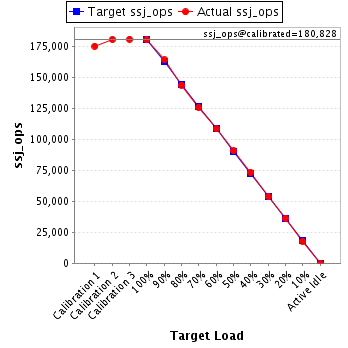
| ssj_ops@calibrated=180,828 | |||
| 100% | 99.9% | 180,828 | 180,565 |
| 90% | 90.8% | 162,745 | 164,170 |
| 80% | 79.6% | 144,662 | 143,949 |
| 70% | 69.7% | 126,579 | 126,117 |
| 60% | 60.0% | 108,497 | 108,553 |
| 50% | 50.2% | 90,414 | 90,720 |
| 40% | 40.7% | 72,331 | 73,541 |
| 30% | 29.8% | 54,248 | 53,891 |
| 20% | 20.1% | 36,166 | 36,337 |
| 10% | 9.9% | 18,083 | 17,840 |
| Active Idle | 0 | 0 | |
| Target Load | Actual Load | ssj_ops | |
|---|---|---|---|
| Target | Actual | ||
| Calibration 1 | 172,996 | ||
| Calibration 2 | 178,165 | ||
| Calibration 3 | 177,861 | ||
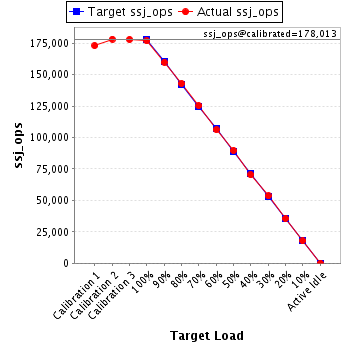
| ssj_ops@calibrated=178,013 | |||
| 100% | 99.3% | 178,013 | 176,760 |
| 90% | 89.8% | 160,212 | 159,819 |
| 80% | 80.3% | 142,410 | 142,919 |
| 70% | 70.4% | 124,609 | 125,282 |
| 60% | 59.7% | 106,808 | 106,190 |
| 50% | 50.3% | 89,007 | 89,611 |
| 40% | 39.5% | 71,205 | 70,267 |
| 30% | 30.1% | 53,404 | 53,500 |
| 20% | 19.9% | 35,603 | 35,494 |
| 10% | 10.0% | 17,801 | 17,758 |
| Active Idle | 0 | 0 | |
| Target Load | Actual Load | ssj_ops | |
|---|---|---|---|
| Target | Actual | ||
| Calibration 1 | 174,305 | ||
| Calibration 2 | 179,098 | ||
| Calibration 3 | 179,640 | ||
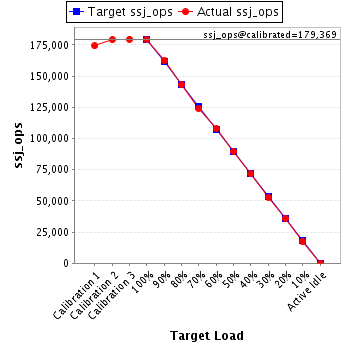
| ssj_ops@calibrated=179,369 | |||
| 100% | 100.0% | 179,369 | 179,433 |
| 90% | 90.4% | 161,432 | 162,177 |
| 80% | 79.7% | 143,495 | 142,937 |
| 70% | 69.2% | 125,558 | 124,116 |
| 60% | 60.1% | 107,621 | 107,809 |
| 50% | 50.0% | 89,685 | 89,750 |
| 40% | 40.0% | 71,748 | 71,778 |
| 30% | 29.6% | 53,811 | 53,025 |
| 20% | 19.9% | 35,874 | 35,623 |
| 10% | 9.9% | 17,937 | 17,779 |
| Active Idle | 0 | 0 | |
| Target Load | Actual Load | ssj_ops | |
|---|---|---|---|
| Target | Actual | ||
| Calibration 1 | 174,680 | ||
| Calibration 2 | 180,813 | ||
| Calibration 3 | 180,730 | ||
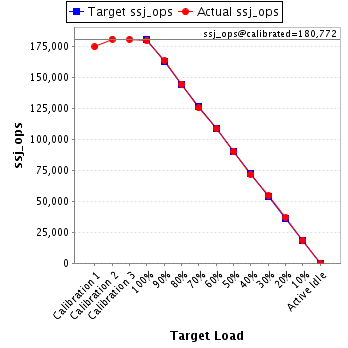
| ssj_ops@calibrated=180,772 | |||
| 100% | 99.6% | 180,772 | 180,016 |
| 90% | 90.4% | 162,695 | 163,444 |
| 80% | 79.9% | 144,617 | 144,527 |
| 70% | 69.4% | 126,540 | 125,422 |
| 60% | 60.1% | 108,463 | 108,665 |
| 50% | 49.8% | 90,386 | 90,065 |
| 40% | 39.7% | 72,309 | 71,844 |
| 30% | 30.1% | 54,232 | 54,327 |
| 20% | 20.3% | 36,154 | 36,708 |
| 10% | 10.2% | 18,077 | 18,411 |
| Active Idle | 0 | 0 | |
| Target Load | Actual Load | ssj_ops | |
|---|---|---|---|
| Target | Actual | ||
| Calibration 1 | 172,266 | ||
| Calibration 2 | 177,458 | ||
| Calibration 3 | 176,959 | ||
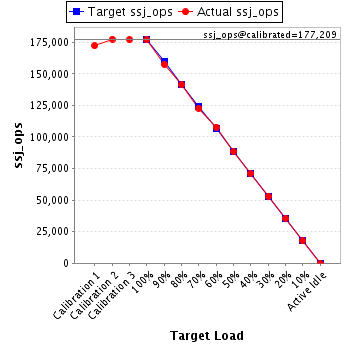
| ssj_ops@calibrated=177,209 | |||
| 100% | 99.9% | 177,209 | 176,961 |
| 90% | 89.0% | 159,488 | 157,641 |
| 80% | 79.7% | 141,767 | 141,245 |
| 70% | 69.3% | 124,046 | 122,852 |
| 60% | 60.8% | 106,325 | 107,825 |
| 50% | 49.8% | 88,604 | 88,333 |
| 40% | 40.0% | 70,883 | 70,932 |
| 30% | 29.9% | 53,163 | 53,032 |
| 20% | 20.1% | 35,442 | 35,573 |
| 10% | 10.0% | 17,721 | 17,723 |
| Active Idle | 0 | 0 | |