SPECpower_ssj2008
Host 'Computer' Performance Report
Copyright © 2007-2012 Standard Performance Evaluation Corporation
| Cisco Systems, Inc. UCS C220 M3 | ssj_ops@100% = 1,443,280 ssj_ops@100% per JVM = 180,410 |
||||
| Test Sponsor: | Cisco Systems, Inc. | SPEC License #: | 3184 | Test Method: | Single Node |
| Tested By: | Principled Technologies, Inc. | Test Location: | Durham, NC, USA | Test Date: | Oct 3, 2012 |
| Hardware Availability: | Mar-2012 | Software Availability: | Aug-2012 | Publication: | Oct 17, 2012 |
| System Source: | Single Supplier | System Designation: | Server | Power Provisioning: | Line-powered |
| Target Load | Actual Load | ssj_ops | |
|---|---|---|---|
| Target | Actual | ||
| Calibration 1 | 1,437,830 | ||
| Calibration 2 | 1,465,946 | ||
| Calibration 3 | 1,469,589 | ||
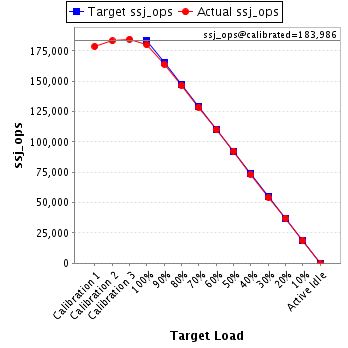
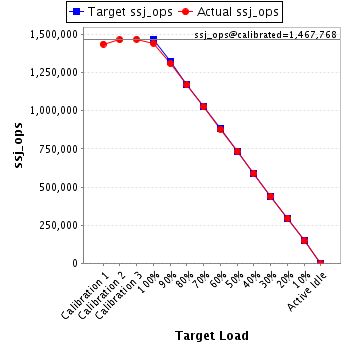
| ssj_ops@calibrated=1,467,768 | |||
| 100% | 98.3% | 1,467,768 | 1,443,280 |
| 90% | 89.3% | 1,320,991 | 1,310,409 |
| 80% | 79.7% | 1,174,214 | 1,170,404 |
| 70% | 69.9% | 1,027,437 | 1,025,951 |
| 60% | 60.0% | 880,661 | 880,394 |
| 50% | 50.1% | 733,884 | 734,623 |
| 40% | 40.1% | 587,107 | 588,584 |
| 30% | 29.9% | 440,330 | 438,980 |
| 20% | 20.0% | 293,554 | 294,230 |
| 10% | 10.0% | 146,777 | 146,499 |
| Active Idle | 0 | 0 | |
| Set Identifier: | sut |
| Set Description: | System Under Test |
| # of Identical Nodes: | 1 |
| Comment: | UCS C220 M3 Rack Server |
| Hardware | |
|---|---|
| Hardware Vendor: | Cisco Systems, Inc. |
| Model: | UCS C220 M3 |
| Form Factor: | 1U |
| CPU Name: | Intel Xeon E5-2660 |
| CPU Characteristics: | 8 Core, 2.20 GHz (Intel Turbo Boost Technology up to 3.00 GHz) |
| CPU Frequency (MHz): | 2200 |
| CPU(s) Enabled: | 16 cores, 2 chips, 8 cores/chip |
| Hardware Threads: | 32 (2 / core) |
| CPU(s) Orderable: | 1,2 chips |
| Primary Cache: | 32 KB I + 32 KB D on chip per core |
| Secondary Cache: | 256 KB I+D on chip per core |
| Tertiary Cache: | 20 MB I+D on chip per chip |
| Other Cache: | None |
| Memory Amount (GB): | 24 |
| # and size of DIMM: | 6 x 4096 MB |
| Memory Details: | 4GB 2Rx8 PC3L-10600E-9 ECC; Slots A1-C1,E1-G1 populated. |
| Power Supply Quantity and Rating (W): | 1 x 450 |
| Power Supply Details: | Cisco P/N UCSC-PSU-450W |
| Disk Drive: | 1 x 100GB Std Height 15mm SATA SSD, Cisco P/N UCS-SD100G0KA2-E |
| Disk Controller: | Integrated Storage Controller Unit (SCU) |
| # and type of Network Interface Cards (NICs) Installed: | 2 x 1 GbE Intel i350 PCIe-based Gigabit Ethernet controller |
| NICs Enabled in Firmware / OS / Connected: | 2/1/1 |
| Network Speed (Mbit): | 1000 |
| Keyboard: | None |
| Mouse: | None |
| Monitor: | None |
| Optical Drives: | No |
| Other Hardware: | None |
| Software | |
|---|---|
| Power Management: | Enabled (see SUT Notes) |
| Operating System (OS): | Microsoft Windows Server 2008 R2 Enterprise Edition |
| OS Version: | SP1 |
| Filesystem: | NTFS |
| JVM Vendor: | IBM Corporation |
| JVM Version: | IBM J9 VM (build 2.6,JRE 1.7.0 Windows Server 2008 R2 amd64-64 20120322_106209 JIT enabled, AOT enabled) |
| JVM Command-line Options: | -Xaggressive -Xcompressedrefs -Xmx1600m -Xms1600m -Xmn1300m -XlockReservation -Xnoloa -XtlhPrefetch -Xlp -Xconcurrentlevel0 |
| JVM Affinity: | start /high /affinity [F,F0,F00,F000,F0000,F00000,F000000,F0000000] |
| JVM Instances: | 8 |
| JVM Initial Heap (MB): | 1600 |
| JVM Maximum Heap (MB): | 1600 |
| JVM Address Bits: | 64 |
| Boot Firmware Version: | 1.4.6a.0 |
| Management Firmware Version: | 1.4(5b) |
| Workload Version: | SSJ 1.2.10 |
| Director Location: | Controller |
| Other Software: | IBM SDK Java Technology Edition Version 7.0 for Windows x64 |
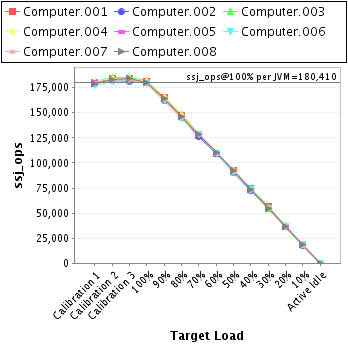
| JVM Instance | ssj_ops@100% |
|---|---|
| Computer.001 | 181,555 |
| Computer.002 | 180,025 |
| Computer.003 | 182,654 |
| Computer.004 | 181,128 |
| Computer.005 | 179,486 |
| Computer.006 | 179,314 |
| Computer.007 | 179,128 |
| Computer.008 | 179,992 |
| ssj_ops@100% | 1,443,280 |
| ssj_ops@100% per JVM | 180,410 |
| Target Load | Actual Load | ssj_ops | |
|---|---|---|---|
| Target | Actual | ||
| Calibration 1 | 180,218 | ||
| Calibration 2 | 184,666 | ||
| Calibration 3 | 184,611 | ||
| ssj_ops@calibrated=184,639 | |||
| 100% | 98.3% | 184,639 | 181,555 |
| 90% | 89.4% | 166,175 | 165,154 |
| 80% | 79.9% | 147,711 | 147,467 |
| 70% | 69.2% | 129,247 | 127,853 |
| 60% | 59.3% | 110,783 | 109,549 |
| 50% | 49.9% | 92,319 | 92,219 |
| 40% | 40.2% | 73,855 | 74,198 |
| 30% | 30.4% | 55,392 | 56,207 |
| 20% | 20.0% | 36,928 | 36,966 |
| 10% | 9.9% | 18,464 | 18,323 |
| Active Idle | 0 | 0 | |
| Target Load | Actual Load | ssj_ops | |
|---|---|---|---|
| Target | Actual | ||
| Calibration 1 | 178,959 | ||
| Calibration 2 | 182,264 | ||
| Calibration 3 | 181,469 | ||
| ssj_ops@calibrated=181,867 | |||
| 100% | 99.0% | 181,867 | 180,025 |
| 90% | 89.4% | 163,680 | 162,666 |
| 80% | 80.2% | 145,493 | 145,768 |
| 70% | 69.7% | 127,307 | 126,679 |
| 60% | 60.0% | 109,120 | 109,071 |
| 50% | 49.8% | 90,933 | 90,554 |
| 40% | 40.2% | 72,747 | 73,031 |
| 30% | 29.8% | 54,560 | 54,275 |
| 20% | 20.3% | 36,373 | 36,939 |
| 10% | 10.0% | 18,187 | 18,201 |
| Active Idle | 0 | 0 | |

| Target Load | Actual Load | ssj_ops | |
|---|---|---|---|
| Target | Actual | ||
| Calibration 1 | 180,912 | ||
| Calibration 2 | 185,289 | ||
| Calibration 3 | 185,506 | ||
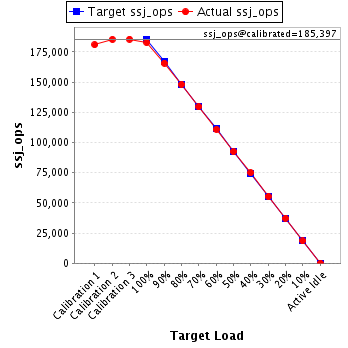
| ssj_ops@calibrated=185,397 | |||
| 100% | 98.5% | 185,397 | 182,654 |
| 90% | 89.4% | 166,858 | 165,681 |
| 80% | 79.9% | 148,318 | 148,065 |
| 70% | 69.8% | 129,778 | 129,455 |
| 60% | 59.8% | 111,238 | 110,792 |
| 50% | 49.8% | 92,699 | 92,401 |
| 40% | 40.4% | 74,159 | 74,884 |
| 30% | 29.8% | 55,619 | 55,252 |
| 20% | 20.2% | 37,079 | 37,406 |
| 10% | 9.9% | 18,540 | 18,436 |
| Active Idle | 0 | 0 | |
| Target Load | Actual Load | ssj_ops | |
|---|---|---|---|
| Target | Actual | ||
| Calibration 1 | 180,725 | ||
| Calibration 2 | 184,312 | ||
| Calibration 3 | 183,894 | ||
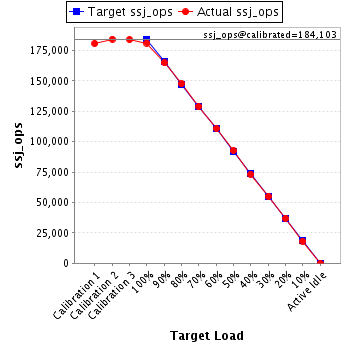
| ssj_ops@calibrated=184,103 | |||
| 100% | 98.4% | 184,103 | 181,128 |
| 90% | 89.6% | 165,693 | 164,934 |
| 80% | 80.1% | 147,282 | 147,553 |
| 70% | 70.1% | 128,872 | 128,980 |
| 60% | 60.2% | 110,462 | 110,895 |
| 50% | 50.4% | 92,051 | 92,768 |
| 40% | 39.8% | 73,641 | 73,337 |
| 30% | 29.9% | 55,231 | 55,090 |
| 20% | 20.1% | 36,821 | 37,037 |
| 10% | 9.9% | 18,410 | 18,230 |
| Active Idle | 0 | 0 | |
| Target Load | Actual Load | ssj_ops | |
|---|---|---|---|
| Target | Actual | ||
| Calibration 1 | 180,630 | ||
| Calibration 2 | 181,919 | ||
| Calibration 3 | 183,911 | ||
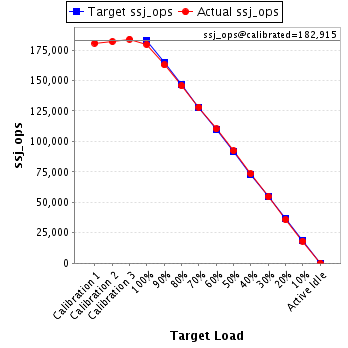
| ssj_ops@calibrated=182,915 | |||
| 100% | 98.1% | 182,915 | 179,486 |
| 90% | 89.0% | 164,624 | 162,763 |
| 80% | 79.6% | 146,332 | 145,561 |
| 70% | 70.0% | 128,041 | 128,124 |
| 60% | 60.3% | 109,749 | 110,211 |
| 50% | 50.4% | 91,458 | 92,257 |
| 40% | 40.1% | 73,166 | 73,359 |
| 30% | 29.8% | 54,875 | 54,597 |
| 20% | 19.5% | 36,583 | 35,716 |
| 10% | 9.9% | 18,292 | 18,196 |
| Active Idle | 0 | 0 | |
| Target Load | Actual Load | ssj_ops | |
|---|---|---|---|
| Target | Actual | ||
| Calibration 1 | 177,583 | ||
| Calibration 2 | 181,609 | ||
| Calibration 3 | 182,325 | ||
| ssj_ops@calibrated=181,967 | |||
| 100% | 98.5% | 181,967 | 179,314 |
| 90% | 89.4% | 163,770 | 162,628 |
| 80% | 79.5% | 145,574 | 144,744 |
| 70% | 70.3% | 127,377 | 127,895 |
| 60% | 60.3% | 109,180 | 109,788 |
| 50% | 50.0% | 90,983 | 90,944 |
| 40% | 40.1% | 72,787 | 73,057 |
| 30% | 30.1% | 54,590 | 54,699 |
| 20% | 20.1% | 36,393 | 36,539 |
| 10% | 10.1% | 18,197 | 18,398 |
| Active Idle | 0 | 0 | |

| Target Load | Actual Load | ssj_ops | |
|---|---|---|---|
| Target | Actual | ||
| Calibration 1 | 180,016 | ||
| Calibration 2 | 182,599 | ||
| Calibration 3 | 183,189 | ||
| ssj_ops@calibrated=182,894 | |||
| 100% | 97.9% | 182,894 | 179,128 |
| 90% | 88.8% | 164,605 | 162,499 |
| 80% | 79.2% | 146,315 | 144,899 |
| 70% | 70.2% | 128,026 | 128,327 |
| 60% | 60.2% | 109,736 | 110,089 |
| 50% | 49.8% | 91,447 | 91,020 |
| 40% | 40.1% | 73,158 | 73,374 |
| 30% | 29.9% | 54,868 | 54,603 |
| 20% | 20.1% | 36,579 | 36,782 |
| 10% | 9.9% | 18,289 | 18,171 |
| Active Idle | 0 | 0 | |

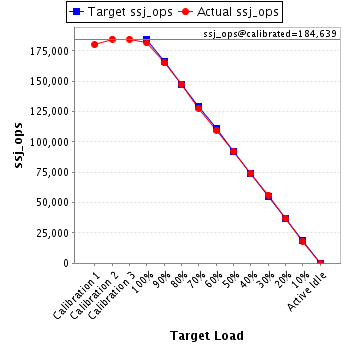
| Target Load | Actual Load | ssj_ops | |
|---|---|---|---|
| Target | Actual | ||
| Calibration 1 | 178,787 | ||
| Calibration 2 | 183,288 | ||
| Calibration 3 | 184,684 | ||
| ssj_ops@calibrated=183,986 | |||
| 100% | 97.8% | 183,986 | 179,992 |
| 90% | 89.2% | 165,587 | 164,084 |
| 80% | 79.5% | 147,189 | 146,346 |
| 70% | 69.9% | 128,790 | 128,637 |
| 60% | 59.8% | 110,392 | 109,999 |
| 50% | 50.3% | 91,993 | 92,460 |
| 40% | 39.9% | 73,594 | 73,343 |
| 30% | 29.5% | 55,196 | 54,259 |
| 20% | 20.0% | 36,797 | 36,846 |
| 10% | 10.1% | 18,399 | 18,543 |
| Active Idle | 0 | 0 | |