SPECpower_ssj2008
Aggregate Performance Report
Copyright © 2007-2012 Standard Performance Evaluation Corporation
| Huawei Technologies Co., Ltd BH622 V2 | ssj_ops@100% = 5,271,615 ssj_ops@100% per Host = 1,317,904 ssj_ops@100% per JVM = 164,738 |
||||
| Test Sponsor: | Huawei Technologies Co., Ltd | SPEC License #: | 3175 | Test Method: | Multi Node |
| Tested By: | Huawei Technologies Co., Ltd | Test Location: | Shenzhen, Guangdong, China | Test Date: | Aug 21, 2012 |
| Hardware Availability: | Aug-2012 | Software Availability: | Dec-2011 | Publication: | Sep 5, 2012 |
| System Source: | Single Supplier | System Designation: | Server | Power Provisioning: | Line-powered |
| Target Load | Actual Load | ssj_ops | |
|---|---|---|---|
| Target | Actual | ||
| Calibration 1 | 5,295,514 | ||
| Calibration 2 | 5,275,057 | ||
| Calibration 3 | 5,272,246 | ||
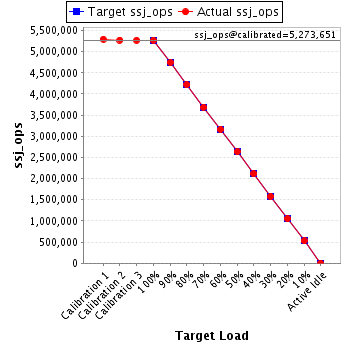
| ssj_ops@calibrated=5,273,651 | |||
| 100% | 100.0% | 5,273,651 | 5,271,615 |
| 90% | 90.1% | 4,746,286 | 4,749,859 |
| 80% | 80.0% | 4,218,921 | 4,219,661 |
| 70% | 70.0% | 3,691,556 | 3,689,073 |
| 60% | 60.0% | 3,164,191 | 3,166,051 |
| 50% | 50.0% | 2,636,826 | 2,636,508 |
| 40% | 40.1% | 2,109,461 | 2,112,447 |
| 30% | 30.0% | 1,582,095 | 1,580,582 |
| 20% | 19.9% | 1,054,730 | 1,051,574 |
| 10% | 10.0% | 527,365 | 528,088 |
| Active Idle | 0 | 0 | |
| # of Nodes | # of Chips | # of Cores | # of Threads | Total RAM (GB) | # of OS Images | # of JVM Instances |
|---|---|---|---|---|---|---|
| 4 | 8 | 64 | 128 | 64.0 | 4 | 32 |
| Set Identifier: | sut |
| Set Description: | System Under Test |
| # of Identical Nodes: | 4 |
| Comment: | None |
| Hardware per Node | |
|---|---|
| Hardware Vendor: | Huawei Technologies Co., Ltd |
| Model: | BH622 V2 |
| Form Factor: | Blade |
| CPU Name: | Intel Xeon E5-2660 |
| CPU Characteristics: | 8-Core, 2.20 GHz, 20 MB L3 Cache (Turbo Boost Technology up to 3.00 GHz) |
| CPU Frequency (MHz): | 2200 |
| CPU(s) Enabled: | 16 cores, 2 chips, 8 cores/chip |
| Hardware Threads: | 32 (2 / core) |
| CPU(s) Orderable: | 1,2, chips |
| Primary Cache: | 32 KB I + 32 KB D on chip per core |
| Secondary Cache: | 256 KB I+D on chip per core |
| Tertiary Cache: | 20 MB I+D on chip per chip |
| Other Cache: | None |
| Memory Amount (GB): | 16 |
| # and size of DIMM: | 4 x 4 GB |
| Memory Details: | 4GB 2Rx8 PC3L-10600R ECC RDIMM, Slots A1 B1, E1,F1,populated |
| Power Supply Quantity and Rating (W): | None |
| Power Supply Details: | Shared |
| Disk Drive: | 1 x 160GB SSD 2.5" SATA, Huawei P/N 02310KSX |
| Disk Controller: | Integrated SATA controller |
| # and type of Network Interface Cards (NICs) Installed: | 1 x Dual-port Intel 82580 Gigabit Ethernet controller |
| NICs Enabled in Firmware / OS / Connected: | 2/2/1 |
| Network Speed (Mbit): | 1000 |
| Keyboard: | None |
| Mouse: | None |
| Monitor: | None |
| Optical Drives: | No |
| Other Hardware: | None |
| Software per Node | |
|---|---|
| Power Management: | Power Saver enabled in OS |
| Operating System (OS): | Microsoft Windows Server 2008 Enterprise x64 Edition |
| OS Version: | R2 SP1 |
| Filesystem: | NTFS |
| JVM Vendor: | Oracle Corporation |
| JVM Version: | Oracle Java HotSpot(TM) 64-Bit Server VM on Windows, version 1.6.0_30 |
| JVM Command-line Options: | -server -Xmx1600m -Xms1600m -Xmn1200m -XX:ParallelGCThreads=2 -XX:SurvivorRatio=60 -XX:TargetSurvivorRatio=90 -XX:InlineSmallCode=3900 -XX:MaxInlineSize=270 -XX:FreqInlineSize=2500 -XX:AllocatePrefetchDistance=256 -XX:AllocatePrefetchLines=4 -XX:InitialTenuringThreshold=12 -XX:MaxTenuringThreshold=15 -XX:LoopUnrollLimit=45 -XX:+UseCompressedStrings -XX:+AggressiveOpts -XX:+UseLargePages -XX:+UseParallelOldGC |
| JVM Affinity: | start /affinity [0xF,0xF0,0xF00,0xF000,0xF0000,0xF00000,0xF000000,0xF0000000,0xF00000000,0xF000000000,0xF0000000000,0xF00000000000,0xF000000000000,0xF0000000000000,0xF00000000000000,0xF000000000000000] |
| JVM Instances: | 8 |
| JVM Initial Heap (MB): | 1600 |
| JVM Maximum Heap (MB): | 1600 |
| JVM Address Bits: | 64 |
| Boot Firmware Version: | V030 |
| Management Firmware Version: | 3.06 |
| Workload Version: | SSJ 1.2.9 |
| Director Location: | Controller |
| Other Software: | None |
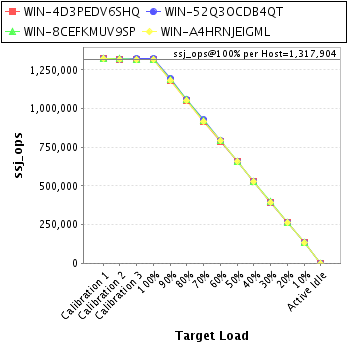
| Host | ssj_ops@100% |
|---|---|
| WIN-4D3PEDV6SHQ | 1,315,789 |
| WIN-52Q3OCDB4QT | 1,322,136 |
| WIN-8CEFKMUV9SP | 1,317,290 |
| WIN-A4HRNJEIGML | 1,316,400 |
| ssj_ops@100% | 5,271,615 |
| ssj_ops@100% per Host | 1,317,904 |
| ssj_ops@100% per JVM | 164,738 |
| Target Load | Actual Load | ssj_ops | |
|---|---|---|---|
| Target | Actual | ||
| Calibration 1 | 1,321,834 | ||
| Calibration 2 | 1,317,128 | ||
| Calibration 3 | 1,315,925 | ||
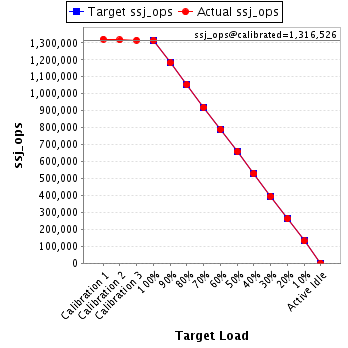
| ssj_ops@calibrated=1,316,526 | |||
| 100% | 99.9% | 1,316,526 | 1,315,789 |
| 90% | 89.8% | 1,184,874 | 1,182,810 |
| 80% | 80.1% | 1,053,221 | 1,054,054 |
| 70% | 69.8% | 921,568 | 918,914 |
| 60% | 60.0% | 789,916 | 789,956 |
| 50% | 50.1% | 658,263 | 658,997 |
| 40% | 40.1% | 526,611 | 528,102 |
| 30% | 30.0% | 394,958 | 394,924 |
| 20% | 19.9% | 263,305 | 262,597 |
| 10% | 10.0% | 131,653 | 131,430 |
| Active Idle | 0 | 0 | |
| Target Load | Actual Load | ssj_ops | |
|---|---|---|---|
| Target | Actual | ||
| Calibration 1 | 1,323,886 | ||
| Calibration 2 | 1,319,038 | ||
| Calibration 3 | 1,321,868 | ||
| ssj_ops@calibrated=1,320,453 | |||
| 100% | 100.1% | 1,320,453 | 1,322,136 |
| 90% | 90.4% | 1,188,407 | 1,194,267 |
| 80% | 79.9% | 1,056,362 | 1,055,504 |
| 70% | 70.2% | 924,317 | 926,873 |
| 60% | 59.9% | 792,272 | 790,957 |
| 50% | 49.7% | 660,226 | 656,601 |
| 40% | 39.9% | 528,181 | 527,513 |
| 30% | 29.8% | 396,136 | 393,871 |
| 20% | 19.9% | 264,091 | 262,732 |
| 10% | 10.0% | 132,045 | 132,209 |
| Active Idle | 0 | 0 | |

| Target Load | Actual Load | ssj_ops | |
|---|---|---|---|
| Target | Actual | ||
| Calibration 1 | 1,325,341 | ||
| Calibration 2 | 1,320,630 | ||
| Calibration 3 | 1,317,661 | ||
| ssj_ops@calibrated=1,319,146 | |||
| 100% | 99.9% | 1,319,146 | 1,317,290 |
| 90% | 90.1% | 1,187,231 | 1,189,128 |
| 80% | 80.2% | 1,055,317 | 1,057,648 |
| 70% | 70.1% | 923,402 | 924,630 |
| 60% | 60.2% | 791,488 | 794,118 |
| 50% | 50.1% | 659,573 | 660,291 |
| 40% | 40.1% | 527,658 | 528,321 |
| 30% | 30.1% | 395,744 | 396,829 |
| 20% | 20.0% | 263,829 | 263,311 |
| 10% | 10.0% | 131,915 | 132,383 |
| Active Idle | 0 | 0 | |

| Target Load | Actual Load | ssj_ops | |
|---|---|---|---|
| Target | Actual | ||
| Calibration 1 | 1,324,453 | ||
| Calibration 2 | 1,318,261 | ||
| Calibration 3 | 1,316,792 | ||
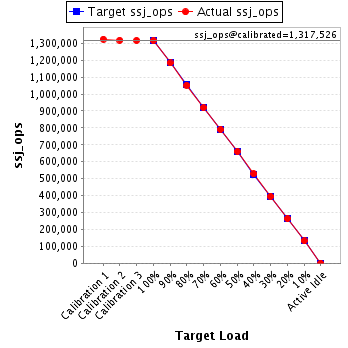
| ssj_ops@calibrated=1,317,526 | |||
| 100% | 99.9% | 1,317,526 | 1,316,400 |
| 90% | 89.8% | 1,185,774 | 1,183,654 |
| 80% | 79.9% | 1,054,021 | 1,052,455 |
| 70% | 69.7% | 922,269 | 918,655 |
| 60% | 60.0% | 790,516 | 791,020 |
| 50% | 50.1% | 658,763 | 660,619 |
| 40% | 40.1% | 527,011 | 528,512 |
| 30% | 30.0% | 395,258 | 394,959 |
| 20% | 20.0% | 263,505 | 262,934 |
| 10% | 10.0% | 131,753 | 132,066 |
| Active Idle | 0 | 0 | |