
SPECpower_ssj2008
Host 'x3755m3-1' Performance Report
Copyright © 2007-2011 Standard Performance Evaluation Corporation
| IBM Corporation IBM System x3755 M3 | ssj_ops@100% = 2,242,893 ssj_ops@100% per JVM = 140,181 |
||||
| Test Sponsor: | IBM Corporation | SPEC License #: | 11 | Test Method: | Single Node |
| Tested By: | IBM Corporation | Test Location: | Nangang, Taipei, Taiwan | Test Date: | Nov 4, 2011 |
| Hardware Availability: | Dec-2011 | Software Availability: | Mar-2011 | Publication: | Nov 30, 2011 |
| System Source: | Single Supplier | System Designation: | Server | Power Provisioning: | Line-powered |
| Target Load | Actual Load | ssj_ops | |
|---|---|---|---|
| Target | Actual | ||
| Calibration 1 | 2,205,050 | ||
| Calibration 2 | 2,250,049 | ||
| Calibration 3 | 2,243,818 | ||
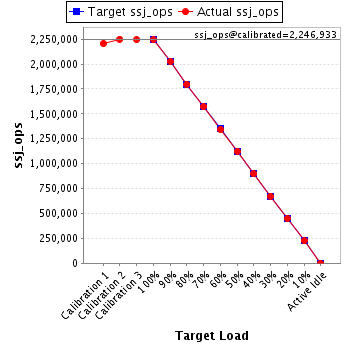
| ssj_ops@calibrated=2,246,933 | |||
| 100% | 99.8% | 2,246,933 | 2,242,893 |
| 90% | 90.1% | 2,022,240 | 2,025,294 |
| 80% | 80.0% | 1,797,547 | 1,797,742 |
| 70% | 70.0% | 1,572,853 | 1,572,792 |
| 60% | 59.8% | 1,348,160 | 1,343,532 |
| 50% | 50.0% | 1,123,467 | 1,123,790 |
| 40% | 40.0% | 898,773 | 897,715 |
| 30% | 30.0% | 674,080 | 674,531 |
| 20% | 20.0% | 449,387 | 448,391 |
| 10% | 10.0% | 224,693 | 225,278 |
| Active Idle | 0 | 0 | |
| Set Identifier: | sut |
| Set Description: | System Under Test |
| # of Identical Nodes: | 1 |
| Comment: | None |
| Hardware | |
|---|---|
| Hardware Vendor: | IBM Corporation |
| Model: | IBM System x3755 M3 |
| Form Factor: | 2U |
| CPU Name: | AMD Opteron 6276 (2.30 GHz) |
| CPU Characteristics: | 16-Core, 2.3GHz, 16 MB L3 Cache |
| CPU Frequency (MHz): | 2300 |
| CPU(s) Enabled: | 64 cores, 4 chips, 16 cores/chip |
| Hardware Threads: | 64 (1 / core) |
| CPU(s) Orderable: | 2,4 chips |
| Primary Cache: | 512 KB I + 256 KB D on chip per chip |
| Secondary Cache: | 16 MB I+D on chip per chip, 2 MB shared / 2 cores |
| Tertiary Cache: | 16 MB I+D on chip per chip, 8 MB shared / 8 cores |
| Other Cache: | None |
| Memory Amount (GB): | 64 |
| # and size of DIMM: | 16 x 4096 MB |
| Memory Details: | 4GB 2Rx8 PC3L-10600E; slots 1, 3, 5, 7, 9, 11, 13, 15, 17, 19, 21, 23, 25, 27, 29 and 31 populated |
| Power Supply Quantity and Rating (W): | 1 x 1100 |
| Power Supply Details: | IBM PN 49Y4934 |
| Disk Drive: | 1 x 250GB SATA |
| Disk Controller: | Integrated SATA controller |
| # and type of Network Interface Cards (NICs) Installed: | 4 x Integrated Broadcom NetXtreme II Gigabit NIC |
| NICs Enabled in Firmware / OS / Connected: | 1/1/1 |
| Network Speed (Mbit): | 1000 |
| Keyboard: | KVM |
| Mouse: | KVM |
| Monitor: | KVM |
| Optical Drives: | Yes |
| Other Hardware: | None |
| Software | |
|---|---|
| Power Management: | Enabled (See SUT Note) |
| Operating System (OS): | Microsoft Windows Server 2008 Enterprise Edition x64 |
| OS Version: | Service Pack 1 |
| Filesystem: | NTFS |
| JVM Vendor: | IBM Corporation |
| JVM Version: | IBM J9 VM (build 2.4, J2RE 1.6.0 IBM J9 2.4 Windows Server 2008 amd64-64 jvm pwa6460sr5-20090406_01(SR5) (JIT enabled, AOT enabled) |
| JVM Command-line Options: | -Xaggressive -Xcompressedrefs -Xgcpolicy:gencon -Xmn1400m -Xms1875m -Xmx1875m -XlockReservation -Xnoloa -Xlp |
| JVM Affinity: | start /affinity [F, 0F, 00F, 000F, 0000F, 00000F, 000000F, 0000000F, 00000000F, 000000000F, 0000000000F, 00000000000F, 000000000000F, 0000000000000F, 00000000000000F, 000000000000000F] |
| JVM Instances: | 16 |
| JVM Initial Heap (MB): | 1875 |
| JVM Maximum Heap (MB): | 1875 |
| JVM Address Bits: | 64 |
| Boot Firmware Version: | 154b |
| Management Firmware Version: | ayoo32f |
| Workload Version: | SSJ 1.2.9 |
| Director Location: | Controller |
| Other Software: | None |
| JVM Instance | ssj_ops@100% |
|---|---|
| x3755m3-1.001 | 138,538 |
| x3755m3-1.002 | 140,122 |
| x3755m3-1.003 | 138,649 |
| x3755m3-1.004 | 143,756 |
| x3755m3-1.005 | 140,392 |
| x3755m3-1.006 | 141,560 |
| x3755m3-1.007 | 139,722 |
| x3755m3-1.008 | 139,781 |
| x3755m3-1.009 | 138,704 |
| x3755m3-1.010 | 140,596 |
| x3755m3-1.011 | 140,408 |
| x3755m3-1.012 | 141,323 |
| x3755m3-1.013 | 139,249 |
| x3755m3-1.014 | 139,184 |
| x3755m3-1.015 | 140,047 |
| x3755m3-1.016 | 140,862 |
| ssj_ops@100% | 2,242,893 |
| ssj_ops@100% per JVM | 140,181 |

| Target Load | Actual Load | ssj_ops | |
|---|---|---|---|
| Target | Actual | ||
| Calibration 1 | 136,455 | ||
| Calibration 2 | 138,489 | ||
| Calibration 3 | 138,339 | ||
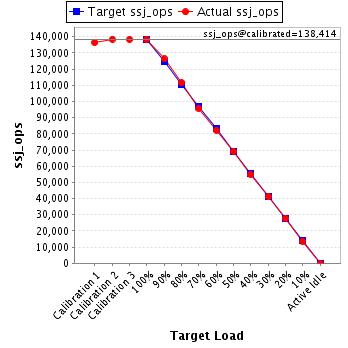
| ssj_ops@calibrated=138,414 | |||
| 100% | 100.1% | 138,414 | 138,538 |
| 90% | 91.3% | 124,572 | 126,423 |
| 80% | 80.6% | 110,731 | 111,607 |
| 70% | 69.2% | 96,890 | 95,805 |
| 60% | 59.5% | 83,048 | 82,325 |
| 50% | 50.1% | 69,207 | 69,354 |
| 40% | 39.7% | 55,366 | 54,972 |
| 30% | 29.7% | 41,524 | 41,090 |
| 20% | 20.0% | 27,683 | 27,719 |
| 10% | 9.8% | 13,841 | 13,606 |
| Active Idle | 0 | 0 | |
| Target Load | Actual Load | ssj_ops | |
|---|---|---|---|
| Target | Actual | ||
| Calibration 1 | 137,148 | ||
| Calibration 2 | 140,382 | ||
| Calibration 3 | 140,116 | ||
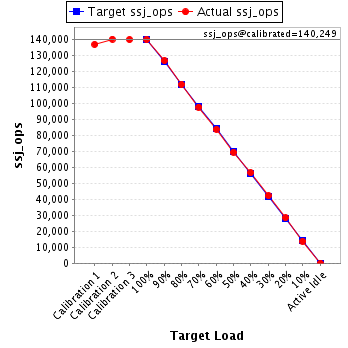
| ssj_ops@calibrated=140,249 | |||
| 100% | 99.9% | 140,249 | 140,122 |
| 90% | 90.5% | 126,224 | 126,938 |
| 80% | 79.8% | 112,199 | 111,956 |
| 70% | 69.8% | 98,174 | 97,875 |
| 60% | 59.9% | 84,149 | 83,955 |
| 50% | 49.6% | 70,124 | 69,610 |
| 40% | 40.4% | 56,100 | 56,719 |
| 30% | 30.1% | 42,075 | 42,263 |
| 20% | 20.3% | 28,050 | 28,449 |
| 10% | 9.9% | 14,025 | 13,825 |
| Active Idle | 0 | 0 | |
| Target Load | Actual Load | ssj_ops | |
|---|---|---|---|
| Target | Actual | ||
| Calibration 1 | 134,097 | ||
| Calibration 2 | 139,030 | ||
| Calibration 3 | 139,197 | ||
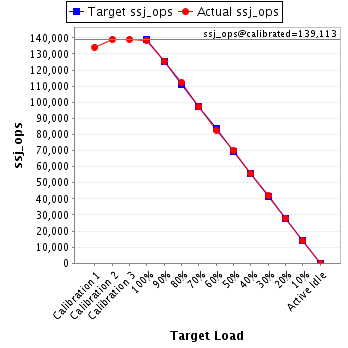
| ssj_ops@calibrated=139,113 | |||
| 100% | 99.7% | 139,113 | 138,649 |
| 90% | 90.2% | 125,202 | 125,521 |
| 80% | 80.7% | 111,291 | 112,262 |
| 70% | 69.8% | 97,379 | 97,066 |
| 60% | 59.5% | 83,468 | 82,745 |
| 50% | 50.3% | 69,557 | 70,011 |
| 40% | 39.9% | 55,645 | 55,562 |
| 30% | 30.1% | 41,734 | 41,834 |
| 20% | 20.1% | 27,823 | 27,952 |
| 10% | 10.0% | 13,911 | 13,858 |
| Active Idle | 0 | 0 | |
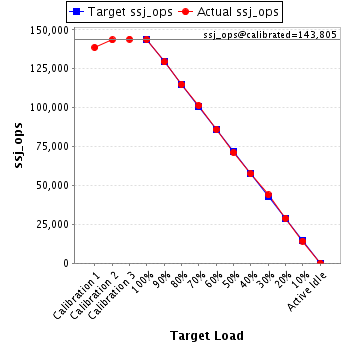
| Target Load | Actual Load | ssj_ops | |
|---|---|---|---|
| Target | Actual | ||
| Calibration 1 | 138,719 | ||
| Calibration 2 | 143,554 | ||
| Calibration 3 | 144,056 | ||
| ssj_ops@calibrated=143,805 | |||
| 100% | 100.0% | 143,805 | 143,756 |
| 90% | 90.0% | 129,424 | 129,393 |
| 80% | 79.9% | 115,044 | 114,963 |
| 70% | 70.5% | 100,663 | 101,435 |
| 60% | 59.8% | 86,283 | 86,039 |
| 50% | 49.5% | 71,902 | 71,201 |
| 40% | 39.9% | 57,522 | 57,405 |
| 30% | 30.6% | 43,141 | 43,949 |
| 20% | 20.1% | 28,761 | 28,963 |
| 10% | 9.9% | 14,380 | 14,286 |
| Active Idle | 0 | 0 | |
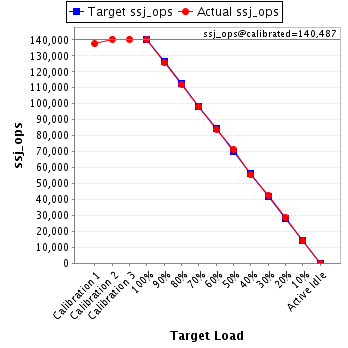
| Target Load | Actual Load | ssj_ops | |
|---|---|---|---|
| Target | Actual | ||
| Calibration 1 | 137,594 | ||
| Calibration 2 | 140,485 | ||
| Calibration 3 | 140,489 | ||
| ssj_ops@calibrated=140,487 | |||
| 100% | 99.9% | 140,487 | 140,392 |
| 90% | 89.6% | 126,438 | 125,855 |
| 80% | 79.8% | 112,390 | 112,097 |
| 70% | 69.8% | 98,341 | 98,070 |
| 60% | 59.8% | 84,292 | 84,053 |
| 50% | 50.7% | 70,243 | 71,293 |
| 40% | 39.5% | 56,195 | 55,520 |
| 30% | 30.3% | 42,146 | 42,527 |
| 20% | 20.3% | 28,097 | 28,566 |
| 10% | 10.0% | 14,049 | 14,008 |
| Active Idle | 0 | 0 | |
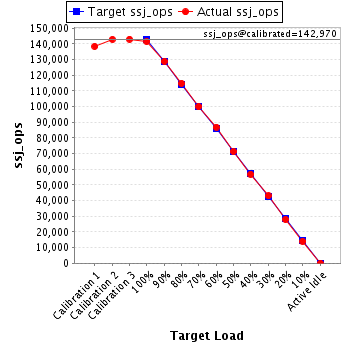
| Target Load | Actual Load | ssj_ops | |
|---|---|---|---|
| Target | Actual | ||
| Calibration 1 | 138,448 | ||
| Calibration 2 | 142,919 | ||
| Calibration 3 | 143,020 | ||
| ssj_ops@calibrated=142,970 | |||
| 100% | 99.0% | 142,970 | 141,560 |
| 90% | 90.2% | 128,673 | 128,901 |
| 80% | 80.3% | 114,376 | 114,848 |
| 70% | 69.9% | 100,079 | 99,966 |
| 60% | 60.8% | 85,782 | 86,909 |
| 50% | 49.9% | 71,485 | 71,375 |
| 40% | 39.7% | 57,188 | 56,803 |
| 30% | 30.1% | 42,891 | 43,038 |
| 20% | 19.6% | 28,594 | 27,960 |
| 10% | 9.8% | 14,297 | 14,069 |
| Active Idle | 0 | 0 | |
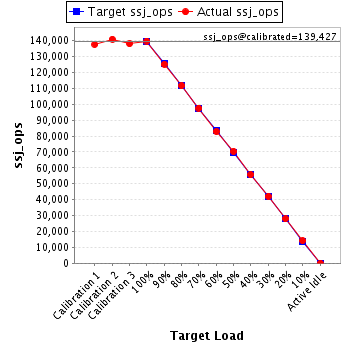
| Target Load | Actual Load | ssj_ops | |
|---|---|---|---|
| Target | Actual | ||
| Calibration 1 | 137,657 | ||
| Calibration 2 | 140,894 | ||
| Calibration 3 | 137,960 | ||
| ssj_ops@calibrated=139,427 | |||
| 100% | 100.2% | 139,427 | 139,722 |
| 90% | 89.8% | 125,484 | 125,147 |
| 80% | 80.0% | 111,542 | 111,577 |
| 70% | 70.0% | 97,599 | 97,591 |
| 60% | 59.4% | 83,656 | 82,797 |
| 50% | 50.5% | 69,714 | 70,435 |
| 40% | 39.9% | 55,771 | 55,598 |
| 30% | 30.2% | 41,828 | 42,161 |
| 20% | 20.0% | 27,885 | 27,887 |
| 10% | 10.2% | 13,943 | 14,154 |
| Active Idle | 0 | 0 | |
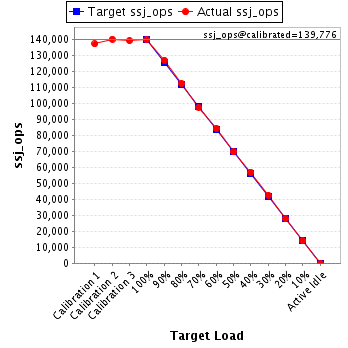
| Target Load | Actual Load | ssj_ops | |
|---|---|---|---|
| Target | Actual | ||
| Calibration 1 | 137,251 | ||
| Calibration 2 | 140,254 | ||
| Calibration 3 | 139,298 | ||
| ssj_ops@calibrated=139,776 | |||
| 100% | 100.0% | 139,776 | 139,781 |
| 90% | 90.9% | 125,798 | 127,097 |
| 80% | 80.5% | 111,821 | 112,555 |
| 70% | 69.9% | 97,843 | 97,739 |
| 60% | 60.3% | 83,866 | 84,342 |
| 50% | 49.8% | 69,888 | 69,657 |
| 40% | 40.8% | 55,910 | 57,041 |
| 30% | 30.5% | 41,933 | 42,607 |
| 20% | 19.9% | 27,955 | 27,842 |
| 10% | 10.0% | 13,978 | 13,974 |
| Active Idle | 0 | 0 | |
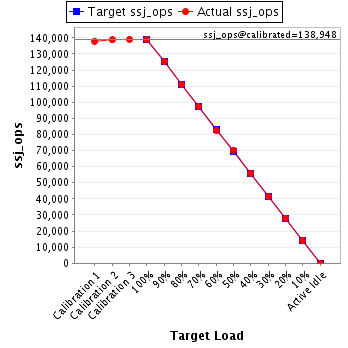
| Target Load | Actual Load | ssj_ops | |
|---|---|---|---|
| Target | Actual | ||
| Calibration 1 | 138,015 | ||
| Calibration 2 | 138,700 | ||
| Calibration 3 | 139,197 | ||
| ssj_ops@calibrated=138,948 | |||
| 100% | 99.8% | 138,948 | 138,704 |
| 90% | 90.0% | 125,054 | 125,021 |
| 80% | 79.9% | 111,159 | 111,038 |
| 70% | 70.2% | 97,264 | 97,503 |
| 60% | 59.4% | 83,369 | 82,584 |
| 50% | 50.6% | 69,474 | 70,336 |
| 40% | 40.3% | 55,579 | 56,053 |
| 30% | 29.9% | 41,685 | 41,537 |
| 20% | 20.1% | 27,790 | 27,917 |
| 10% | 10.1% | 13,895 | 14,064 |
| Active Idle | 0 | 0 | |
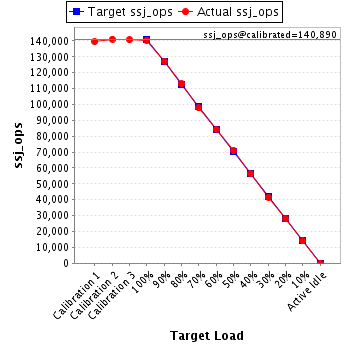
| Target Load | Actual Load | ssj_ops | |
|---|---|---|---|
| Target | Actual | ||
| Calibration 1 | 139,567 | ||
| Calibration 2 | 141,127 | ||
| Calibration 3 | 140,654 | ||
| ssj_ops@calibrated=140,890 | |||
| 100% | 99.8% | 140,890 | 140,596 |
| 90% | 90.2% | 126,801 | 127,139 |
| 80% | 80.3% | 112,712 | 113,074 |
| 70% | 69.4% | 98,623 | 97,847 |
| 60% | 59.9% | 84,534 | 84,401 |
| 50% | 50.4% | 70,445 | 70,962 |
| 40% | 39.9% | 56,356 | 56,263 |
| 30% | 29.6% | 42,267 | 41,659 |
| 20% | 19.8% | 28,178 | 27,958 |
| 10% | 10.0% | 14,089 | 14,046 |
| Active Idle | 0 | 0 | |
| Target Load | Actual Load | ssj_ops | |
|---|---|---|---|
| Target | Actual | ||
| Calibration 1 | 139,131 | ||
| Calibration 2 | 140,282 | ||
| Calibration 3 | 140,876 | ||
| ssj_ops@calibrated=140,579 | |||
| 100% | 99.9% | 140,579 | 140,408 |
| 90% | 90.1% | 126,521 | 126,664 |
| 80% | 80.0% | 112,463 | 112,413 |
| 70% | 70.5% | 98,405 | 99,171 |
| 60% | 59.5% | 84,347 | 83,704 |
| 50% | 50.6% | 70,290 | 71,119 |
| 40% | 39.9% | 56,232 | 56,072 |
| 30% | 29.7% | 42,174 | 41,795 |
| 20% | 19.8% | 28,116 | 27,808 |
| 10% | 10.3% | 14,058 | 14,545 |
| Active Idle | 0 | 0 | |

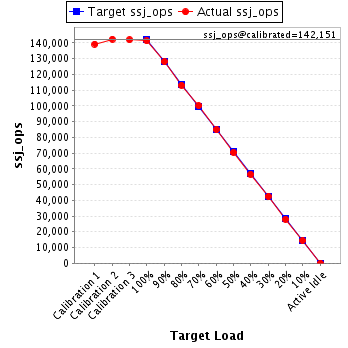
| Target Load | Actual Load | ssj_ops | |
|---|---|---|---|
| Target | Actual | ||
| Calibration 1 | 139,281 | ||
| Calibration 2 | 142,390 | ||
| Calibration 3 | 141,912 | ||
| ssj_ops@calibrated=142,151 | |||
| 100% | 99.4% | 142,151 | 141,323 |
| 90% | 90.1% | 127,936 | 128,089 |
| 80% | 79.6% | 113,721 | 113,085 |
| 70% | 70.4% | 99,506 | 100,145 |
| 60% | 59.8% | 85,291 | 84,996 |
| 50% | 49.5% | 71,075 | 70,425 |
| 40% | 39.7% | 56,860 | 56,496 |
| 30% | 29.9% | 42,645 | 42,517 |
| 20% | 19.6% | 28,430 | 27,931 |
| 10% | 10.2% | 14,215 | 14,470 |
| Active Idle | 0 | 0 | |
| Target Load | Actual Load | ssj_ops | |
|---|---|---|---|
| Target | Actual | ||
| Calibration 1 | 137,450 | ||
| Calibration 2 | 139,675 | ||
| Calibration 3 | 139,569 | ||
| ssj_ops@calibrated=139,622 | |||
| 100% | 99.7% | 139,622 | 139,249 |
| 90% | 89.4% | 125,660 | 124,780 |
| 80% | 79.3% | 111,698 | 110,723 |
| 70% | 69.8% | 97,735 | 97,504 |
| 60% | 59.9% | 83,773 | 83,627 |
| 50% | 49.4% | 69,811 | 68,926 |
| 40% | 39.7% | 55,849 | 55,471 |
| 30% | 30.1% | 41,887 | 42,017 |
| 20% | 20.0% | 27,924 | 27,897 |
| 10% | 10.2% | 13,962 | 14,187 |
| Active Idle | 0 | 0 | |

| Target Load | Actual Load | ssj_ops | |
|---|---|---|---|
| Target | Actual | ||
| Calibration 1 | 137,416 | ||
| Calibration 2 | 139,800 | ||
| Calibration 3 | 138,188 | ||
| ssj_ops@calibrated=138,994 | |||
| 100% | 100.1% | 138,994 | 139,184 |
| 90% | 90.4% | 125,095 | 125,600 |
| 80% | 79.8% | 111,195 | 110,897 |
| 70% | 70.3% | 97,296 | 97,774 |
| 60% | 59.9% | 83,397 | 83,258 |
| 50% | 49.6% | 69,497 | 68,927 |
| 40% | 39.9% | 55,598 | 55,408 |
| 30% | 29.4% | 41,698 | 40,861 |
| 20% | 19.8% | 27,799 | 27,549 |
| 10% | 10.1% | 13,899 | 13,978 |
| Active Idle | 0 | 0 | |

| Target Load | Actual Load | ssj_ops | |
|---|---|---|---|
| Target | Actual | ||
| Calibration 1 | 137,887 | ||
| Calibration 2 | 140,377 | ||
| Calibration 3 | 140,148 | ||
| ssj_ops@calibrated=140,263 | |||
| 100% | 99.8% | 140,263 | 140,047 |
| 90% | 89.2% | 126,237 | 125,053 |
| 80% | 80.3% | 112,210 | 112,615 |
| 70% | 69.4% | 98,184 | 97,333 |
| 60% | 59.8% | 84,158 | 83,909 |
| 50% | 49.7% | 70,131 | 69,675 |
| 40% | 40.1% | 56,105 | 56,276 |
| 30% | 30.2% | 42,079 | 42,310 |
| 20% | 20.2% | 28,053 | 28,292 |
| 10% | 9.9% | 14,026 | 13,904 |
| Active Idle | 0 | 0 | |

| Target Load | Actual Load | ssj_ops | |
|---|---|---|---|
| Target | Actual | ||
| Calibration 1 | 138,935 | ||
| Calibration 2 | 141,692 | ||
| Calibration 3 | 140,798 | ||
| ssj_ops@calibrated=141,245 | |||
| 100% | 99.7% | 141,245 | 140,862 |
| 90% | 90.4% | 127,120 | 127,673 |
| 80% | 79.3% | 112,996 | 112,033 |
| 70% | 70.8% | 98,871 | 99,968 |
| 60% | 59.4% | 84,747 | 83,890 |
| 50% | 49.9% | 70,622 | 70,484 |
| 40% | 39.7% | 56,498 | 56,054 |
| 30% | 30.0% | 42,373 | 42,366 |
| 20% | 19.6% | 28,249 | 27,701 |
| 10% | 10.1% | 14,124 | 14,304 |
| Active Idle | 0 | 0 | |
