SPECpower_ssj2008
Host 'R710' Performance Report
Copyright © 2007-2011 Standard Performance Evaluation Corporation
| Dell Inc. Dell PowerEdge R710 (Intel Xeon X5675, 3.06 GHz) | ssj_ops@100% = 955,936 ssj_ops@100% per JVM = 477,968 |
||||
| Test Sponsor: | Dell Inc. | SPEC License #: | 55 | Test Method: | Single Node |
| Tested By: | Dell Inc. | Test Location: | Round Rock, TX, USA | Test Date: | Oct 11, 2011 |
| Hardware Availability: | Feb-2011 | Software Availability: | Apr-2011 | Publication: | Nov 2, 2011 |
| System Source: | Single Supplier | System Designation: | Server | Power Provisioning: | Line-powered |
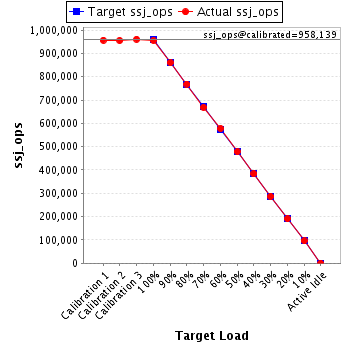
| Target Load | Actual Load | ssj_ops | |
|---|---|---|---|
| Target | Actual | ||
| Calibration 1 | 956,812 | ||
| Calibration 2 | 955,171 | ||
| Calibration 3 | 961,107 | ||
| ssj_ops@calibrated=958,139 | |||
| 100% | 99.8% | 958,139 | 955,936 |
| 90% | 89.8% | 862,325 | 860,708 |
| 80% | 80.2% | 766,511 | 768,669 |
| 70% | 69.8% | 670,697 | 668,881 |
| 60% | 60.4% | 574,883 | 578,522 |
| 50% | 49.9% | 479,069 | 478,275 |
| 40% | 40.0% | 383,256 | 383,208 |
| 30% | 30.0% | 287,442 | 287,023 |
| 20% | 19.9% | 191,628 | 190,309 |
| 10% | 10.0% | 95,814 | 95,754 |
| Active Idle | 0 | 0 | |
| Set Identifier: | sut |
| Set Description: | System Under Test |
| # of Identical Nodes: | 1 |
| Comment: | None |
| Hardware | |
|---|---|
| Hardware Vendor: | Dell Inc. |
| Model: | Dell PowerEdge R710 (Intel Xeon X5675, 3.06 GHz) |
| Form Factor: | 2U |
| CPU Name: | Intel Xeon X5675 |
| CPU Characteristics: | 6 Core, 3.06 GHz |
| CPU Frequency (MHz): | 3066 |
| CPU(s) Enabled: | 12 cores, 2 chips, 6 cores/chip |
| Hardware Threads: | 24 (2 / core) |
| CPU(s) Orderable: | 1,2 chip |
| Primary Cache: | 32 KB I + 32 KB D on chip per core |
| Secondary Cache: | 256 KB I+D on chip per core |
| Tertiary Cache: | 12 MB I+D on chip per chip |
| Other Cache: | None |
| Memory Amount (GB): | 24 |
| # and size of DIMM: | 6 x 4096 MB |
| Memory Details: | 4GB 2Rx4 PC3L-10600R ECC |
| Power Supply Quantity and Rating (W): | 1 x 570 |
| Power Supply Details: | Dell P/N VPR1M |
| Disk Drive: | 1 x 50GB SSD 2.5" SATA (Dell PN X2N7H) |
| Disk Controller: | PERC H200 Integrated |
| # and type of Network Interface Cards (NICs) Installed: | 2 x dual-port onboard Broadcom NetXtreme II BCM5709C |
| NICs Enabled in Firmware / OS / Connected: | 2/2/1 |
| Network Speed (Mbit): | 1000 |
| Keyboard: | None |
| Mouse: | None |
| Monitor: | None |
| Optical Drives: | No |
| Other Hardware: | None |
| Software | |
|---|---|
| Power Management: | Power Saver Mode in OS (See Notes) |
| Operating System (OS): | Microsoft Windows 2008 Enterprise x64 Edition |
| OS Version: | R2 SP1 |
| Filesystem: | NTFS |
| JVM Vendor: | Oracle Corporation |
| JVM Version: | Oracle Java HotSpot(TM) 64-Bit Server VM on Windows, version 1.6.0_27 |
| JVM Command-line Options: | -server -Xmx6g -Xms6g -Xmn5g -XX:SurvivorRatio=65 -XX:TargetSurvivorRatio=90 -XX:ParallelGCThreads=8 -XX:AllocatePrefetchDistance=192 -XX:AllocatePrefetchLines=4 -XX:LoopUnrollLimit=45 -XX:InitialTenuringThreshold=12 -XX:MaxTenuringThreshold=15 -XX:InlineSmallCode=5500 -XX:MaxInlineSize=220 -XX:FreqInlineSize=2500 -XX:+UseLargePages -XX:+UseParallelOldGC -XX:+UseCompressedStrings -XX:+AggressiveOpts |
| JVM Affinity: | start /affinity [FFF, FFF000]] |
| JVM Instances: | 2 |
| JVM Initial Heap (MB): | 6144 |
| JVM Maximum Heap (MB): | 6144 |
| JVM Address Bits: | 64 |
| Boot Firmware Version: | 6.0.7 |
| Management Firmware Version: | 1.70 Build 21 |
| Workload Version: | SSJ 1.2.6 |
| Director Location: | Controller |
| Other Software: | None |
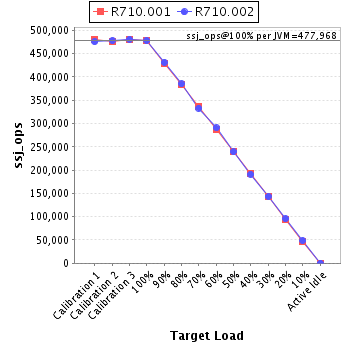
| JVM Instance | ssj_ops@100% |
|---|---|
| R710.001 | 477,950 |
| R710.002 | 477,986 |
| ssj_ops@100% | 955,936 |
| ssj_ops@100% per JVM | 477,968 |
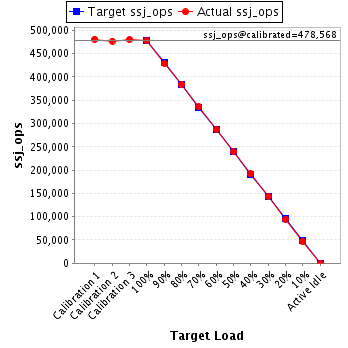
| Target Load | Actual Load | ssj_ops | |
|---|---|---|---|
| Target | Actual | ||
| Calibration 1 | 481,226 | ||
| Calibration 2 | 477,207 | ||
| Calibration 3 | 479,928 | ||
| ssj_ops@calibrated=478,568 | |||
| 100% | 99.9% | 478,568 | 477,950 |
| 90% | 89.7% | 430,711 | 429,445 |
| 80% | 80.2% | 382,854 | 383,689 |
| 70% | 70.1% | 334,997 | 335,678 |
| 60% | 60.2% | 287,141 | 287,917 |
| 50% | 49.9% | 239,284 | 238,957 |
| 40% | 40.1% | 191,427 | 191,949 |
| 30% | 30.0% | 143,570 | 143,804 |
| 20% | 19.8% | 95,714 | 94,830 |
| 10% | 9.9% | 47,857 | 47,219 |
| Active Idle | 0 | 0 | |
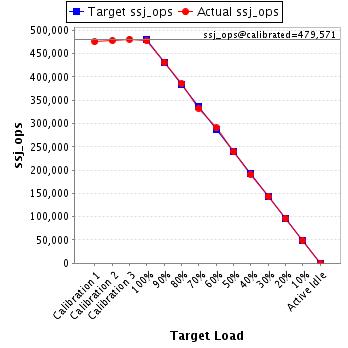
| Target Load | Actual Load | ssj_ops | |
|---|---|---|---|
| Target | Actual | ||
| Calibration 1 | 475,586 | ||
| Calibration 2 | 477,963 | ||
| Calibration 3 | 481,179 | ||
| ssj_ops@calibrated=479,571 | |||
| 100% | 99.7% | 479,571 | 477,986 |
| 90% | 89.9% | 431,614 | 431,263 |
| 80% | 80.3% | 383,657 | 384,980 |
| 70% | 69.5% | 335,700 | 333,203 |
| 60% | 60.6% | 287,743 | 290,604 |
| 50% | 49.9% | 239,786 | 239,318 |
| 40% | 39.9% | 191,829 | 191,259 |
| 30% | 29.9% | 143,871 | 143,219 |
| 20% | 19.9% | 95,914 | 95,479 |
| 10% | 10.1% | 47,957 | 48,535 |
| Active Idle | 0 | 0 | |