SPECpower_ssj2008
Host 'M610-08' Performance Report
Copyright © 2007-2011 Standard Performance Evaluation Corporation
| Dell Inc. PowerEdge M610 | ssj_ops@100% = 924,685 ssj_ops@100% per JVM = 462,343 |
||||
| Test Sponsor: | Dell Inc. | SPEC License #: | 55 | Test Method: | Multi Node |
| Tested By: | Dell Inc. | Test Location: | Round Rock, TX, USA | Test Date: | Sep 26, 2011 |
| Hardware Availability: | Feb-2011 | Software Availability: | Apr-2011 | Publication: | Nov 2, 2011 |
| System Source: | Single Supplier | System Designation: | Server | Power Provisioning: | Line-powered |
| Target Load | Actual Load | ssj_ops | |
|---|---|---|---|
| Target | Actual | ||
| Calibration 1 | 943,467 | ||
| Calibration 2 | 932,814 | ||
| Calibration 3 | 925,326 | ||
| ssj_ops@calibrated=929,070 | |||
| 100% | 99.5% | 929,070 | 924,685 |
| 90% | 89.7% | 836,163 | 833,601 |
| 80% | 80.1% | 743,256 | 744,476 |
| 70% | 70.0% | 650,349 | 650,018 |
| 60% | 60.4% | 557,442 | 560,795 |
| 50% | 50.1% | 464,535 | 465,413 |
| 40% | 40.0% | 371,628 | 371,298 |
| 30% | 30.0% | 278,721 | 278,869 |
| 20% | 19.9% | 185,814 | 185,239 |
| 10% | 9.9% | 92,907 | 92,366 |
| Active Idle | 0 | 0 | |

| Set Identifier: | sut |
| Set Description: | PowerEdge M610 |
| # of Identical Nodes: | 16 |
| Comment: | None |
| Hardware | |
|---|---|
| Hardware Vendor: | Dell Inc. |
| Model: | PowerEdge M610 |
| Form Factor: | Blade |
| CPU Name: | Intel Xeon X5675 (3.06 GHz) |
| CPU Characteristics: | 6 Core, 3.06 GHz, 12 MB L3 Cache |
| CPU Frequency (MHz): | 3060 |
| CPU(s) Enabled: | 12 cores, 2 chips, 6 cores/chip |
| Hardware Threads: | 24 (2 / core) |
| CPU(s) Orderable: | 1,2 chips |
| Primary Cache: | 32 KB I + 32 KB D on chip per core |
| Secondary Cache: | 256 KB I+D on chip per core |
| Tertiary Cache: | 12 MB I+D on chip per chip |
| Other Cache: | None |
| Memory Amount (GB): | 24 |
| # and size of DIMM: | 6 x 4096 MB |
| Memory Details: | 4GB 2Rx8 PC3L-10600R ECC RDIMM, Slots A1, A2, A3, B1, B2, B3 populated |
| Power Supply Quantity and Rating (W): | None |
| Power Supply Details: | Shared |
| Disk Drive: | 1 x 50 GB 2.5" SSD SATA (Dell PN X2N7H) |
| Disk Controller: | Modular SATA Pass-Through |
| # and type of Network Interface Cards (NICs) Installed: | 1 x onboard dual-port 1 Gigabit Ethernet |
| NICs Enabled in Firmware / OS / Connected: | 2/2/1 |
| Network Speed (Mbit): | 1000 |
| Keyboard: | None |
| Mouse: | None |
| Monitor: | None |
| Optical Drives: | No |
| Other Hardware: | None |
| Software | |
|---|---|
| Power Management: | Power Saver Mode in OS (See Notes) |
| Operating System (OS): | Windows 2008 Server Enterprise x64 Edition |
| OS Version: | R2 SP1 |
| Filesystem: | NTFS |
| JVM Vendor: | Oracle Corporation |
| JVM Version: | Oracle Java HotSpot(TM) 64-Bit Server VM on Windows, version 1.6.0_27 |
| JVM Command-line Options: | -server -Xmx4g -Xms4g -Xmn3500m -XX:SurvivorRatio=55 -XX:TargetSurvivorRatio=90 -XX:ParallelGCThreads=12 -XX:AllocatePrefetchDistance=256 -XX:AllocatePrefetchLines=4 -XX:LoopUnrollLimit=45 -XX:InitialTenuringThreshold=12 -XX:MaxTenuringThreshold=15 -XX:InlineSmallCode=3900 -XX:MaxInlineSize=270 -XX:FreqInlineSize=2500 -XX:+UseLargePages -XX:+UseParallelOldGC -XX:+UseCompressedStrings -XX:+AggressiveOpts |
| JVM Affinity: | start /affinity [FFF, FFF000]] |
| JVM Instances: | 2 |
| JVM Initial Heap (MB): | 4096 |
| JVM Maximum Heap (MB): | 4096 |
| JVM Address Bits: | 64 |
| Boot Firmware Version: | 3.0.0 |
| Management Firmware Version: | iDRAC 3.21 build 48 |
| Workload Version: | SSJ 1.2.6 |
| Director Location: | Controller |
| Other Software: | None |
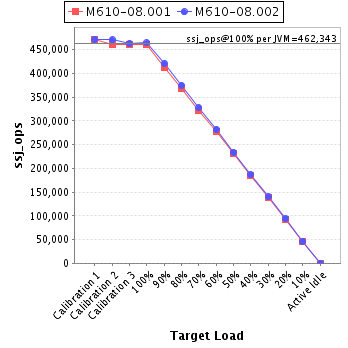
| JVM Instance | ssj_ops@100% |
|---|---|
| M610-08.001 | 460,270 |
| M610-08.002 | 464,415 |
| ssj_ops@100% | 924,685 |
| ssj_ops@100% per JVM | 462,343 |
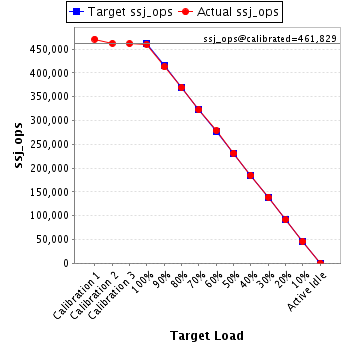
| Target Load | Actual Load | ssj_ops | |
|---|---|---|---|
| Target | Actual | ||
| Calibration 1 | 471,041 | ||
| Calibration 2 | 462,069 | ||
| Calibration 3 | 461,589 | ||
| ssj_ops@calibrated=461,829 | |||
| 100% | 99.7% | 461,829 | 460,270 |
| 90% | 89.4% | 415,646 | 412,758 |
| 80% | 80.0% | 369,463 | 369,372 |
| 70% | 69.8% | 323,281 | 322,550 |
| 60% | 60.3% | 277,098 | 278,695 |
| 50% | 50.2% | 230,915 | 231,635 |
| 40% | 40.0% | 184,732 | 184,769 |
| 30% | 30.1% | 138,549 | 138,895 |
| 20% | 19.8% | 92,366 | 91,333 |
| 10% | 10.0% | 46,183 | 45,984 |
| Active Idle | 0 | 0 | |
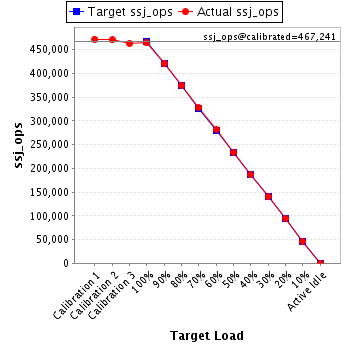
| Target Load | Actual Load | ssj_ops | |
|---|---|---|---|
| Target | Actual | ||
| Calibration 1 | 472,426 | ||
| Calibration 2 | 470,745 | ||
| Calibration 3 | 463,737 | ||
| ssj_ops@calibrated=467,241 | |||
| 100% | 99.4% | 467,241 | 464,415 |
| 90% | 90.1% | 420,517 | 420,843 |
| 80% | 80.3% | 373,793 | 375,104 |
| 70% | 70.1% | 327,069 | 327,468 |
| 60% | 60.4% | 280,345 | 282,100 |
| 50% | 50.0% | 233,621 | 233,778 |
| 40% | 39.9% | 186,896 | 186,528 |
| 30% | 30.0% | 140,172 | 139,975 |
| 20% | 20.1% | 93,448 | 93,906 |
| 10% | 9.9% | 46,724 | 46,383 |
| Active Idle | 0 | 0 | |