SPECpower_ssj2008
Host 'T6000-3' Performance Report
Copyright © 2007-2011 Standard Performance Evaluation Corporation
| Huawei Technologies Co., Ltd XH620 | ssj_ops@100% = 924,002 ssj_ops@100% per JVM = 154,000 |
||||
| Test Sponsor: | Huawei Technologies Co., Ltd | SPEC License #: | 3175 | Test Method: | Multi Node |
| Tested By: | Huawei Technologies Co., Ltd | Test Location: | Shenzhen, Guangdong, China | Test Date: | Jun 2, 2011 |
| Hardware Availability: | Dec-2010 | Software Availability: | Dec-2010 | Publication: | Jul 13, 2011 |
| System Source: | Single Supplier | System Designation: | Server | Power Provisioning: | Line-powered |
| Target Load | Actual Load | ssj_ops | |
|---|---|---|---|
| Target | Actual | ||
| Calibration 1 | 924,916 | ||
| Calibration 2 | 927,793 | ||
| Calibration 3 | 928,803 | ||
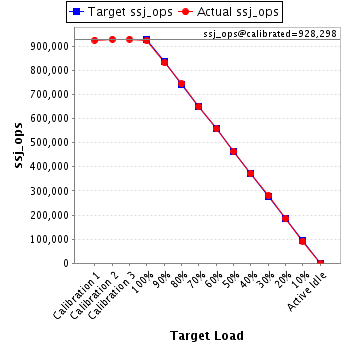
| ssj_ops@calibrated=928,298 | |||
| 100% | 99.5% | 928,298 | 924,002 |
| 90% | 89.6% | 835,468 | 831,574 |
| 80% | 80.1% | 742,639 | 743,900 |
| 70% | 69.9% | 649,809 | 648,893 |
| 60% | 60.0% | 556,979 | 557,214 |
| 50% | 49.9% | 464,149 | 463,338 |
| 40% | 40.0% | 371,319 | 371,553 |
| 30% | 30.1% | 278,489 | 279,378 |
| 20% | 19.9% | 185,660 | 184,477 |
| 10% | 9.9% | 92,830 | 92,247 |
| Active Idle | 0 | 0 | |
| Set Identifier: | sut |
| Set Description: | System Under Test |
| # of Identical Nodes: | 2 |
| Comment: | None |
| Hardware | |
|---|---|
| Hardware Vendor: | Huawei Technologies Co., Ltd |
| Model: | XH620 |
| Form Factor: | 1U |
| CPU Name: | Intel Xeon X5675 |
| CPU Characteristics: | Six-Core, 3.06GHz, 12MB L3 Cache |
| CPU Frequency (MHz): | 3067 |
| CPU(s) Enabled: | 12 cores, 2 chips, 6 cores/chip |
| Hardware Threads: | 24 (2 / core) |
| CPU(s) Orderable: | 2 chips |
| Primary Cache: | 32 KB I + 32 KB D on chip per core |
| Secondary Cache: | 256 KB I+D on chip per core |
| Tertiary Cache: | 12 MB I+D on chip per chip |
| Other Cache: | None |
| Memory Amount (GB): | 16 |
| # and size of DIMM: | 4 x 4 GB |
| Memory Details: | 2GB 2Rx8 PC3L-10600E ECC |
| Power Supply Quantity and Rating (W): | None |
| Power Supply Details: | Shared |
| Disk Drive: | 1 x 160GB SSD 2.5" SATA SA:E64511-309 |
| Disk Controller: | Integrated SATA controller |
| # and type of Network Interface Cards (NICs) Installed: | 1 x Dual-port BCM 5709 Gigabit Ethernet controller |
| NICs Enabled in Firmware / OS / Connected: | 2/2/1 |
| Network Speed (Mbit): | 1000 |
| Keyboard: | None |
| Mouse: | None |
| Monitor: | None |
| Optical Drives: | No |
| Other Hardware: | None |
| Software | |
|---|---|
| Power Management: | Power Saver enabled in OS |
| Operating System (OS): | Windows Server 2008 R2, Enterprise Edition |
| OS Version: | R2 |
| Filesystem: | NTFS |
| JVM Vendor: | IBM Corporation |
| JVM Version: | IBM J9 VM (build 2.4, JRE 1.6.0 IBM J9 2.4 Windows Server 2008 amd64-64 jvmwa6460sr6-20090923_42924 (JIT enabled, AOT enabled) |
| JVM Command-line Options: | -Xaggressive -Xcompressedrefs -Xgcpolicy:gencon -Xmn1625m -Xms1875m -Xmx1875m -XlockReservation -Xnoloa -XtlhPrefetch -Xlp |
| JVM Affinity: | start /affinity [0xF,0xF0,0xF00,0xF000,0xF0000,0xF00000] |
| JVM Instances: | 6 |
| JVM Initial Heap (MB): | 1875 |
| JVM Maximum Heap (MB): | 1875 |
| JVM Address Bits: | 64 |
| Boot Firmware Version: | SAV18 |
| Management Firmware Version: | V018 |
| Workload Version: | SSJ 1.2.6 |
| Director Location: | Controller |
| Other Software: | IBM Websphere application server V7.0 for Windows on X86-64bit |
| JVM Instance | ssj_ops@100% |
|---|---|
| T6000-3.001 | 152,268 |
| T6000-3.002 | 155,155 |
| T6000-3.003 | 154,209 |
| T6000-3.004 | 154,799 |
| T6000-3.005 | 153,106 |
| T6000-3.006 | 154,464 |
| ssj_ops@100% | 924,002 |
| ssj_ops@100% per JVM | 154,000 |

| Target Load | Actual Load | ssj_ops | |
|---|---|---|---|
| Target | Actual | ||
| Calibration 1 | 151,932 | ||
| Calibration 2 | 152,738 | ||
| Calibration 3 | 152,965 | ||
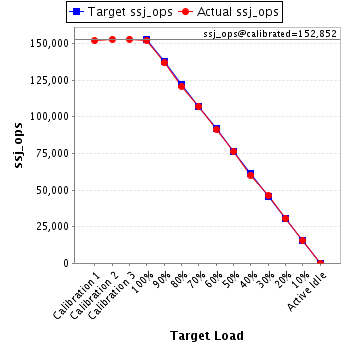
| ssj_ops@calibrated=152,852 | |||
| 100% | 99.6% | 152,852 | 152,268 |
| 90% | 89.5% | 137,566 | 136,798 |
| 80% | 79.1% | 122,281 | 120,977 |
| 70% | 70.0% | 106,996 | 107,052 |
| 60% | 59.9% | 91,711 | 91,495 |
| 50% | 49.9% | 76,426 | 76,307 |
| 40% | 39.4% | 61,141 | 60,198 |
| 30% | 30.3% | 45,855 | 46,287 |
| 20% | 19.9% | 30,570 | 30,493 |
| 10% | 10.1% | 15,285 | 15,412 |
| Active Idle | 0 | 0 | |
| Target Load | Actual Load | ssj_ops | |
|---|---|---|---|
| Target | Actual | ||
| Calibration 1 | 153,244 | ||
| Calibration 2 | 155,463 | ||
| Calibration 3 | 155,487 | ||
| ssj_ops@calibrated=155,475 | |||
| 100% | 99.8% | 155,475 | 155,155 |
| 90% | 89.4% | 139,927 | 139,029 |
| 80% | 80.8% | 124,380 | 125,674 |
| 70% | 69.8% | 108,832 | 108,551 |
| 60% | 59.6% | 93,285 | 92,696 |
| 50% | 49.9% | 77,737 | 77,551 |
| 40% | 40.0% | 62,190 | 62,149 |
| 30% | 30.1% | 46,642 | 46,864 |
| 20% | 19.8% | 31,095 | 30,720 |
| 10% | 9.9% | 15,547 | 15,391 |
| Active Idle | 0 | 0 | |

| Target Load | Actual Load | ssj_ops | |
|---|---|---|---|
| Target | Actual | ||
| Calibration 1 | 154,106 | ||
| Calibration 2 | 154,290 | ||
| Calibration 3 | 154,512 | ||
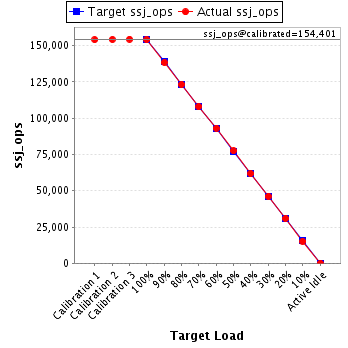
| ssj_ops@calibrated=154,401 | |||
| 100% | 99.9% | 154,401 | 154,209 |
| 90% | 89.7% | 138,961 | 138,456 |
| 80% | 79.8% | 123,521 | 123,274 |
| 70% | 69.9% | 108,081 | 107,979 |
| 60% | 60.4% | 92,640 | 93,217 |
| 50% | 50.2% | 77,200 | 77,452 |
| 40% | 40.0% | 61,760 | 61,780 |
| 30% | 29.9% | 46,320 | 46,209 |
| 20% | 20.0% | 30,880 | 30,951 |
| 10% | 9.8% | 15,440 | 15,137 |
| Active Idle | 0 | 0 | |
| Target Load | Actual Load | ssj_ops | |
|---|---|---|---|
| Target | Actual | ||
| Calibration 1 | 154,931 | ||
| Calibration 2 | 154,737 | ||
| Calibration 3 | 155,685 | ||
| ssj_ops@calibrated=155,211 | |||
| 100% | 99.7% | 155,211 | 154,799 |
| 90% | 89.5% | 139,690 | 138,974 |
| 80% | 80.3% | 124,169 | 124,689 |
| 70% | 69.7% | 108,648 | 108,136 |
| 60% | 60.6% | 93,126 | 94,045 |
| 50% | 50.0% | 77,605 | 77,668 |
| 40% | 40.0% | 62,084 | 62,045 |
| 30% | 30.3% | 46,563 | 47,092 |
| 20% | 20.0% | 31,042 | 31,041 |
| 10% | 9.9% | 15,521 | 15,399 |
| Active Idle | 0 | 0 | |

| Target Load | Actual Load | ssj_ops | |
|---|---|---|---|
| Target | Actual | ||
| Calibration 1 | 154,069 | ||
| Calibration 2 | 154,252 | ||
| Calibration 3 | 154,524 | ||
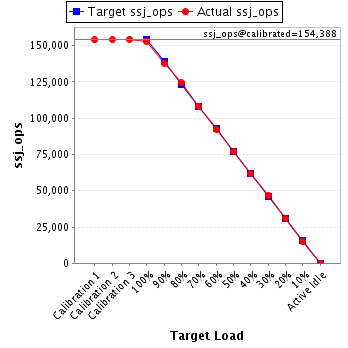
| ssj_ops@calibrated=154,388 | |||
| 100% | 99.2% | 154,388 | 153,106 |
| 90% | 89.4% | 138,949 | 137,970 |
| 80% | 80.5% | 123,510 | 124,342 |
| 70% | 70.1% | 108,071 | 108,195 |
| 60% | 59.8% | 92,633 | 92,347 |
| 50% | 49.8% | 77,194 | 76,951 |
| 40% | 40.0% | 61,755 | 61,697 |
| 30% | 30.2% | 46,316 | 46,675 |
| 20% | 19.9% | 30,878 | 30,724 |
| 10% | 9.8% | 15,439 | 15,163 |
| Active Idle | 0 | 0 | |
| Target Load | Actual Load | ssj_ops | |
|---|---|---|---|
| Target | Actual | ||
| Calibration 1 | 156,633 | ||
| Calibration 2 | 156,314 | ||
| Calibration 3 | 155,630 | ||
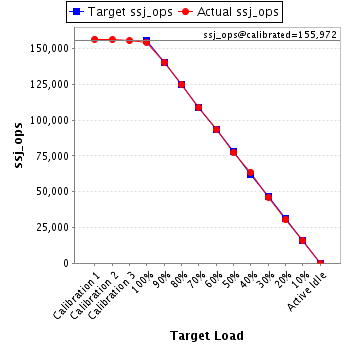
| ssj_ops@calibrated=155,972 | |||
| 100% | 99.0% | 155,972 | 154,464 |
| 90% | 90.0% | 140,375 | 140,348 |
| 80% | 80.1% | 124,778 | 124,944 |
| 70% | 69.9% | 109,181 | 108,979 |
| 60% | 59.9% | 93,583 | 93,415 |
| 50% | 49.6% | 77,986 | 77,410 |
| 40% | 40.8% | 62,389 | 63,684 |
| 30% | 29.7% | 46,792 | 46,251 |
| 20% | 19.6% | 31,194 | 30,548 |
| 10% | 10.1% | 15,597 | 15,745 |
| Active Idle | 0 | 0 | |