SPECpower_ssj2008
Host 'WIN-6DA71QD5U0U' Performance Report
Copyright © 2007-2011 Standard Performance Evaluation Corporation
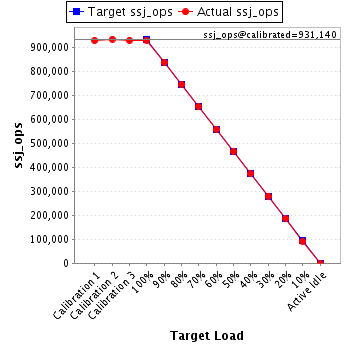
| IBM Corporation IBM System x3400 M3 | ssj_ops@100% = 928,859 ssj_ops@100% per JVM = 154,810 |
||||
| Test Sponsor: | IBM Corporation | SPEC License #: | 11 | Test Method: | Single Node |
| Tested By: | IBM Corporation | Test Location: | Nankang, Taipei, Taiwan | Test Date: | Jan 27, 2011 |
| Hardware Availability: | Mar-2011 | Software Availability: | Oct-2009 | Publication: | Mar 9, 2011 |
| System Source: | Single Supplier | System Designation: | Server | Power Provisioning: | Line-powered |
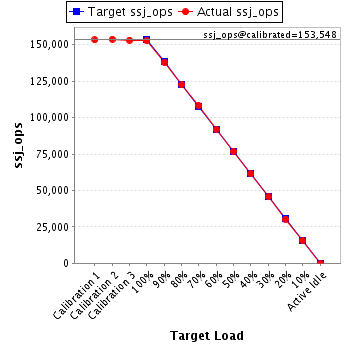
| Target Load | Actual Load | ssj_ops | |
|---|---|---|---|
| Target | Actual | ||
| Calibration 1 | 927,490 | ||
| Calibration 2 | 933,471 | ||
| Calibration 3 | 928,808 | ||
| ssj_ops@calibrated=931,140 | |||
| 100% | 99.8% | 931,140 | 928,859 |
| 90% | 89.9% | 838,026 | 836,682 |
| 80% | 80.0% | 744,912 | 744,890 |
| 70% | 70.1% | 651,798 | 652,854 |
| 60% | 60.0% | 558,684 | 558,577 |
| 50% | 50.1% | 465,570 | 466,565 |
| 40% | 40.1% | 372,456 | 373,297 |
| 30% | 30.1% | 279,342 | 280,002 |
| 20% | 19.9% | 186,228 | 185,577 |
| 10% | 9.9% | 93,114 | 92,314 |
| Active Idle | 0 | 0 | |
| Set Identifier: | sut |
| Set Description: | System Under Test |
| # of Identical Nodes: | 1 |
| Comment: | None |
| Hardware | |
|---|---|
| Hardware Vendor: | IBM Corporation |
| Model: | IBM System x3400 M3 |
| Form Factor: | Tower |
| CPU Name: | Intel Xeon X5675 |
| CPU Characteristics: | 6 core, 3.07GHz, 12MB L3 Cache |
| CPU Frequency (MHz): | 3067 |
| CPU(s) Enabled: | 12 cores, 2 chips, 6 cores/chip |
| Hardware Threads: | 24 (2 / core) |
| CPU(s) Orderable: | 1, 2 chips |
| Primary Cache: | 32 KB I + 32 KB D on chip per core |
| Secondary Cache: | 256 KB I+D on chip per chip |
| Tertiary Cache: | 12 MB I+D off chip per chip |
| Other Cache: | None |
| Memory Amount (GB): | 12 |
| # and size of DIMM: | 6 x 2048 MB |
| Memory Details: | 2GB 2Rx8 PC3L-10600R; slots 3, 6, 8, 11, 14 and 16 populated |
| Power Supply Quantity and Rating (W): | 1 x 670 |
| Power Supply Details: | IBM P/N 39Y7392 |
| Disk Drive: | 1 x 250GB 7.2K RPM SATA |
| Disk Controller: | Integrated SATA controller |
| # and type of Network Interface Cards (NICs) Installed: | 2 x Integrated Broadcom NetXtreme II Gigabit NIC |
| NICs Enabled in Firmware / OS / Connected: | 2/2/1 |
| Network Speed (Mbit): | 1000 |
| Keyboard: | KVM |
| Mouse: | KVM |
| Monitor: | KVM |
| Optical Drives: | No |
| Other Hardware: | None |
| Software | |
|---|---|
| Power Management: | Enabled (See SUT Note) |
| Operating System (OS): | Microsoft Windows Server 2008 Enterprise Edition x64 |
| OS Version: | R2 |
| Filesystem: | NTFS |
| JVM Vendor: | IBM Corporation |
| JVM Version: | IBM J9 VM (build 2.4, J2RE 1.6.0 IBM J9 2.4 Windows Server 2008 amd64-64 jvmwa6460sr5-20090519_35743 (JIT enabled, AOT enabled) |
| JVM Command-line Options: | -Xaggressive -Xcompressedrefs -Xgcpolicy:gencon -Xmn1100m -Xms1500m -Xmx1500m -XlockReservation -Xnoloa -XtlhPrefetch -Xlp |
| JVM Affinity: | start /affinity [F, F0, F00, F000, F0000,,F00000] |
| JVM Instances: | 6 |
| JVM Initial Heap (MB): | 1500 |
| JVM Maximum Heap (MB): | 1500 |
| JVM Address Bits: | 64 |
| Boot Firmware Version: | 150VUS |
| Management Firmware Version: | YUOO96A |
| Workload Version: | SSJ 1.2.6 |
| Director Location: | Controller |
| Other Software: | None |
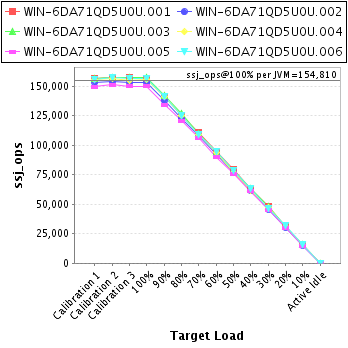
| JVM Instance | ssj_ops@100% |
|---|---|
| WIN-6DA71QD5U0U.001 | 156,383 |
| WIN-6DA71QD5U0U.002 | 152,897 |
| WIN-6DA71QD5U0U.003 | 157,214 |
| WIN-6DA71QD5U0U.004 | 155,707 |
| WIN-6DA71QD5U0U.005 | 149,924 |
| WIN-6DA71QD5U0U.006 | 156,734 |
| ssj_ops@100% | 928,859 |
| ssj_ops@100% per JVM | 154,810 |
| Target Load | Actual Load | ssj_ops | |
|---|---|---|---|
| Target | Actual | ||
| Calibration 1 | 156,592 | ||
| Calibration 2 | 157,512 | ||
| Calibration 3 | 157,506 | ||
| ssj_ops@calibrated=157,509 | |||
| 100% | 99.3% | 157,509 | 156,383 |
| 90% | 89.4% | 141,758 | 140,814 |
| 80% | 79.3% | 126,007 | 124,965 |
| 70% | 70.2% | 110,256 | 110,529 |
| 60% | 59.9% | 94,505 | 94,285 |
| 50% | 50.4% | 78,755 | 79,387 |
| 40% | 40.1% | 63,004 | 63,162 |
| 30% | 30.3% | 47,253 | 47,704 |
| 20% | 19.8% | 31,502 | 31,226 |
| 10% | 9.9% | 15,751 | 15,521 |
| Active Idle | 0 | 0 | |
| Target Load | Actual Load | ssj_ops | |
|---|---|---|---|
| Target | Actual | ||
| Calibration 1 | 153,297 | ||
| Calibration 2 | 153,836 | ||
| Calibration 3 | 153,260 | ||
| ssj_ops@calibrated=153,548 | |||
| 100% | 99.6% | 153,548 | 152,897 |
| 90% | 89.9% | 138,193 | 138,026 |
| 80% | 79.8% | 122,838 | 122,463 |
| 70% | 70.3% | 107,483 | 108,011 |
| 60% | 59.9% | 92,129 | 91,998 |
| 50% | 50.0% | 76,774 | 76,828 |
| 40% | 40.0% | 61,419 | 61,395 |
| 30% | 29.7% | 46,064 | 45,653 |
| 20% | 19.8% | 30,710 | 30,373 |
| 10% | 10.0% | 15,355 | 15,330 |
| Active Idle | 0 | 0 | |
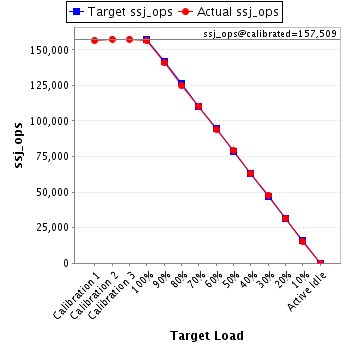
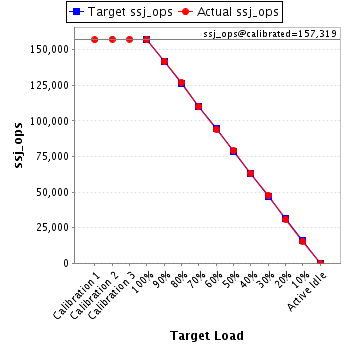
| Target Load | Actual Load | ssj_ops | |
|---|---|---|---|
| Target | Actual | ||
| Calibration 1 | 156,786 | ||
| Calibration 2 | 157,322 | ||
| Calibration 3 | 157,315 | ||
| ssj_ops@calibrated=157,319 | |||
| 100% | 99.9% | 157,319 | 157,214 |
| 90% | 90.1% | 141,587 | 141,731 |
| 80% | 80.6% | 125,855 | 126,874 |
| 70% | 69.9% | 110,123 | 109,975 |
| 60% | 59.9% | 94,391 | 94,174 |
| 50% | 50.1% | 78,659 | 78,839 |
| 40% | 40.3% | 62,927 | 63,326 |
| 30% | 30.3% | 47,196 | 47,652 |
| 20% | 19.7% | 31,464 | 30,979 |
| 10% | 9.9% | 15,732 | 15,608 |
| Active Idle | 0 | 0 | |
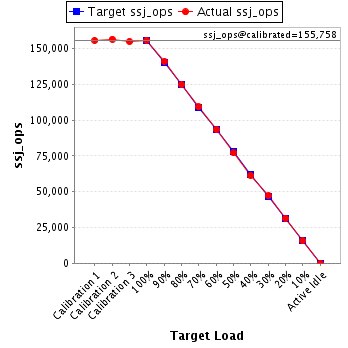
| Target Load | Actual Load | ssj_ops | |
|---|---|---|---|
| Target | Actual | ||
| Calibration 1 | 155,630 | ||
| Calibration 2 | 156,588 | ||
| Calibration 3 | 154,929 | ||
| ssj_ops@calibrated=155,758 | |||
| 100% | 100.0% | 155,758 | 155,707 |
| 90% | 90.5% | 140,182 | 140,988 |
| 80% | 80.1% | 124,607 | 124,753 |
| 70% | 70.1% | 109,031 | 109,218 |
| 60% | 60.1% | 93,455 | 93,547 |
| 50% | 49.5% | 77,879 | 77,076 |
| 40% | 39.4% | 62,303 | 61,344 |
| 30% | 30.2% | 46,727 | 47,097 |
| 20% | 20.2% | 31,152 | 31,415 |
| 10% | 10.1% | 15,576 | 15,672 |
| Active Idle | 0 | 0 | |
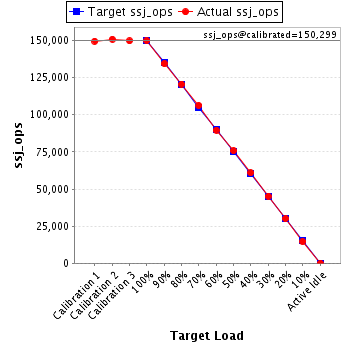
| Target Load | Actual Load | ssj_ops | |
|---|---|---|---|
| Target | Actual | ||
| Calibration 1 | 149,590 | ||
| Calibration 2 | 150,904 | ||
| Calibration 3 | 149,694 | ||
| ssj_ops@calibrated=150,299 | |||
| 100% | 99.8% | 150,299 | 149,924 |
| 90% | 89.4% | 135,269 | 134,372 |
| 80% | 80.3% | 120,239 | 120,687 |
| 70% | 70.8% | 105,209 | 106,362 |
| 60% | 59.6% | 90,179 | 89,624 |
| 50% | 50.4% | 75,149 | 75,749 |
| 40% | 40.5% | 60,120 | 60,861 |
| 30% | 30.1% | 45,090 | 45,204 |
| 20% | 20.0% | 30,060 | 30,030 |
| 10% | 9.7% | 15,030 | 14,621 |
| Active Idle | 0 | 0 | |
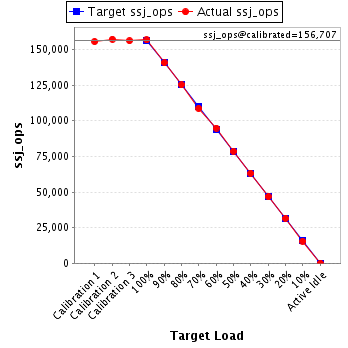
| Target Load | Actual Load | ssj_ops | |
|---|---|---|---|
| Target | Actual | ||
| Calibration 1 | 155,594 | ||
| Calibration 2 | 157,310 | ||
| Calibration 3 | 156,105 | ||
| ssj_ops@calibrated=156,707 | |||
| 100% | 100.0% | 156,707 | 156,734 |
| 90% | 89.8% | 141,037 | 140,751 |
| 80% | 79.9% | 125,366 | 125,148 |
| 70% | 69.4% | 109,695 | 108,760 |
| 60% | 60.6% | 94,024 | 94,948 |
| 50% | 50.2% | 78,354 | 78,685 |
| 40% | 40.3% | 62,683 | 63,209 |
| 30% | 29.8% | 47,012 | 46,691 |
| 20% | 20.1% | 31,341 | 31,555 |
| 10% | 9.9% | 15,671 | 15,562 |
| Active Idle | 0 | 0 | |