SPECpower_ssj2008
Host 'T6000-2' Performance Report
Copyright © 2007-2011 Standard Performance Evaluation Corporation
| Huawei Technologies Co., Ltd XH620 | ssj_ops@100% = 881,210 ssj_ops@100% per JVM = 146,868 |
||||
| Test Sponsor: | Huawei Technologies Co., Ltd | SPEC License #: | 3175 | Test Method: | Multi Node |
| Tested By: | Huawei Technologies Co., Ltd | Test Location: | Shenzhen, Guangdong, China | Test Date: | Feb 11, 2011 |
| Hardware Availability: | Dec-2010 | Software Availability: | Dec-2010 | Publication: | Mar 9, 2011 |
| System Source: | Single Supplier | System Designation: | Server | Power Provisioning: | Line-powered |
| Target Load | Actual Load | ssj_ops | |
|---|---|---|---|
| Target | Actual | ||
| Calibration 1 | 883,203 | ||
| Calibration 2 | 886,027 | ||
| Calibration 3 | 883,937 | ||
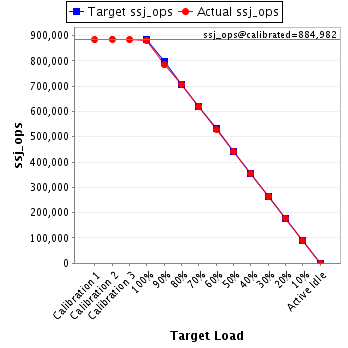
| ssj_ops@calibrated=884,982 | |||
| 100% | 99.6% | 884,982 | 881,210 |
| 90% | 88.6% | 796,484 | 784,010 |
| 80% | 79.9% | 707,986 | 707,508 |
| 70% | 70.0% | 619,487 | 619,689 |
| 60% | 59.9% | 530,989 | 529,772 |
| 50% | 49.8% | 442,491 | 441,160 |
| 40% | 40.1% | 353,993 | 354,870 |
| 30% | 29.9% | 265,495 | 264,883 |
| 20% | 20.1% | 176,996 | 177,559 |
| 10% | 10.0% | 88,498 | 88,334 |
| Active Idle | 0 | 0 | |
| Set Identifier: | sut |
| Set Description: | System Under Test |
| # of Identical Nodes: | 2 |
| Comment: | None |
| Hardware | |
|---|---|
| Hardware Vendor: | Huawei Technologies Co., Ltd |
| Model: | XH620 |
| Form Factor: | 1U |
| CPU Name: | Intel Xeon X5670 |
| CPU Characteristics: | Six-Core, 2.93GHz, 12MB L3 Cache |
| CPU Frequency (MHz): | 2930 |
| CPU(s) Enabled: | 12 cores, 2 chips, 6 cores/chip |
| Hardware Threads: | 24 (2 / core) |
| CPU(s) Orderable: | 2 chips |
| Primary Cache: | 32 KB I + 32 KB D on chip per core |
| Secondary Cache: | 256 KB I+D on chip per core |
| Tertiary Cache: | 12 MB I+D on chip per chip |
| Other Cache: | None |
| Memory Amount (GB): | 12 |
| # and size of DIMM: | 6 x 2 GB |
| Memory Details: | 2GB 2Rx8 PC3L-10600E ECC |
| Power Supply Quantity and Rating (W): | None |
| Power Supply Details: | Shared |
| Disk Drive: | 1 x 160GB SSD 2.5" SATA |
| Disk Controller: | Integrated SATA controller |
| # and type of Network Interface Cards (NICs) Installed: | 1 x Dual-port BCM 5709 Gigabit Ethernet controller |
| NICs Enabled in Firmware / OS / Connected: | 2/2/1 |
| Network Speed (Mbit): | 1000 |
| Keyboard: | None |
| Mouse: | None |
| Monitor: | None |
| Optical Drives: | No |
| Other Hardware: | None |
| Software | |
|---|---|
| Power Management: | Power Saver enabled in OS |
| Operating System (OS): | Windows Server 2008 R2, Enterprise Edition |
| OS Version: | R2 |
| Filesystem: | NTFS |
| JVM Vendor: | IBM Corporation |
| JVM Version: | IBM J9 VM (build 2.4, JRE 1.6.0 IBM J9 2.4 Windows Server 2008 amd64-64 jvmwa6460sr6-20090923_42924 (JIT enabled, AOT enabled) |
| JVM Command-line Options: | -Xaggressive -Xcompressedrefs -Xgcpolicy:gencon -Xmn1100m -Xms1500m -Xmx1500m -XlockReservation -Xnoloa -XtlhPrefetch -Xlp |
| JVM Affinity: | start /affinity [0xF,0xF0,0xF00,0xF000,0xF0000,0xF00000] |
| JVM Instances: | 6 |
| JVM Initial Heap (MB): | 1500 |
| JVM Maximum Heap (MB): | 1500 |
| JVM Address Bits: | 64 |
| Boot Firmware Version: | SAV18 |
| Management Firmware Version: | V018 |
| Workload Version: | SSJ 1.2.6 |
| Director Location: | Controller |
| Other Software: | IBM Websphere application server V7.0 for Windows on X86-64bit |
| JVM Instance | ssj_ops@100% |
|---|---|
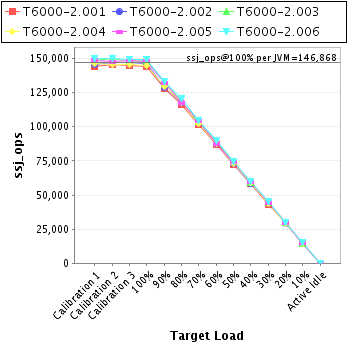
| T6000-2.001 | 144,492 |
| T6000-2.002 | 146,339 |
| T6000-2.003 | 148,368 |
| T6000-2.004 | 144,963 |
| T6000-2.005 | 147,815 |
| T6000-2.006 | 149,232 |
| ssj_ops@100% | 881,210 |
| ssj_ops@100% per JVM | 146,868 |
| Target Load | Actual Load | ssj_ops | |
|---|---|---|---|
| Target | Actual | ||
| Calibration 1 | 144,433 | ||
| Calibration 2 | 145,658 | ||
| Calibration 3 | 144,874 | ||
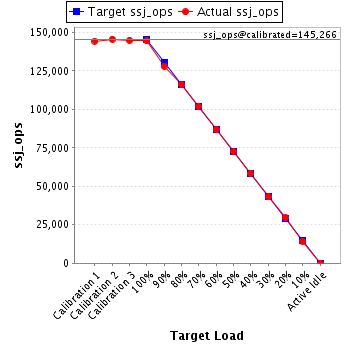
| ssj_ops@calibrated=145,266 | |||
| 100% | 99.5% | 145,266 | 144,492 |
| 90% | 88.1% | 130,739 | 128,034 |
| 80% | 79.9% | 116,213 | 116,046 |
| 70% | 70.2% | 101,686 | 101,992 |
| 60% | 59.9% | 87,160 | 87,010 |
| 50% | 49.8% | 72,633 | 72,379 |
| 40% | 40.2% | 58,106 | 58,410 |
| 30% | 29.7% | 43,580 | 43,085 |
| 20% | 20.3% | 29,053 | 29,530 |
| 10% | 9.9% | 14,527 | 14,332 |
| Active Idle | 0 | 0 | |
| Target Load | Actual Load | ssj_ops | |
|---|---|---|---|
| Target | Actual | ||
| Calibration 1 | 145,755 | ||
| Calibration 2 | 146,845 | ||
| Calibration 3 | 147,121 | ||
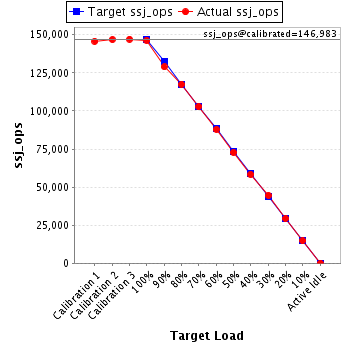
| ssj_ops@calibrated=146,983 | |||
| 100% | 99.6% | 146,983 | 146,339 |
| 90% | 87.7% | 132,285 | 128,942 |
| 80% | 80.0% | 117,586 | 117,553 |
| 70% | 70.0% | 102,888 | 102,841 |
| 60% | 59.8% | 88,190 | 87,932 |
| 50% | 49.5% | 73,492 | 72,806 |
| 40% | 39.6% | 58,793 | 58,271 |
| 30% | 30.3% | 44,095 | 44,604 |
| 20% | 20.0% | 29,397 | 29,374 |
| 10% | 10.0% | 14,698 | 14,766 |
| Active Idle | 0 | 0 | |
| Target Load | Actual Load | ssj_ops | |
|---|---|---|---|
| Target | Actual | ||
| Calibration 1 | 148,480 | ||
| Calibration 2 | 149,957 | ||
| Calibration 3 | 148,134 | ||
| ssj_ops@calibrated=149,045 | |||
| 100% | 99.5% | 149,045 | 148,368 |
| 90% | 88.8% | 134,141 | 132,425 |
| 80% | 79.3% | 119,236 | 118,211 |
| 70% | 69.4% | 104,332 | 103,505 |
| 60% | 60.0% | 89,427 | 89,407 |
| 50% | 50.1% | 74,523 | 74,604 |
| 40% | 39.7% | 59,618 | 59,180 |
| 30% | 29.6% | 44,714 | 44,168 |
| 20% | 20.1% | 29,809 | 29,977 |
| 10% | 9.8% | 14,905 | 14,641 |
| Active Idle | 0 | 0 | |

| Target Load | Actual Load | ssj_ops | |
|---|---|---|---|
| Target | Actual | ||
| Calibration 1 | 146,325 | ||
| Calibration 2 | 145,600 | ||
| Calibration 3 | 145,884 | ||
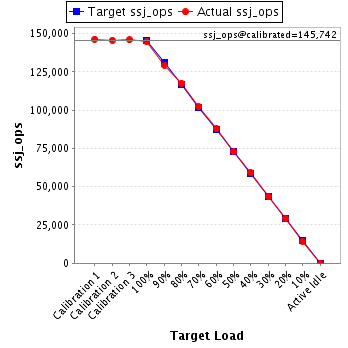
| ssj_ops@calibrated=145,742 | |||
| 100% | 99.5% | 145,742 | 144,963 |
| 90% | 88.8% | 131,168 | 129,356 |
| 80% | 80.7% | 116,594 | 117,622 |
| 70% | 70.2% | 102,020 | 102,257 |
| 60% | 60.3% | 87,445 | 87,917 |
| 50% | 50.0% | 72,871 | 72,910 |
| 40% | 40.7% | 58,297 | 59,342 |
| 30% | 30.0% | 43,723 | 43,722 |
| 20% | 20.0% | 29,148 | 29,086 |
| 10% | 10.0% | 14,574 | 14,510 |
| Active Idle | 0 | 0 | |
| Target Load | Actual Load | ssj_ops | |
|---|---|---|---|
| Target | Actual | ||
| Calibration 1 | 148,548 | ||
| Calibration 2 | 147,746 | ||
| Calibration 3 | 148,500 | ||
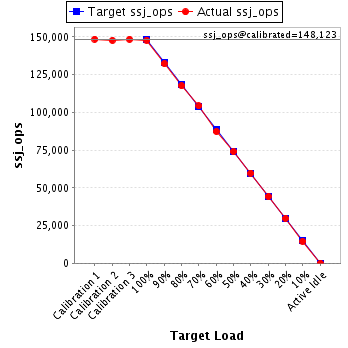
| ssj_ops@calibrated=148,123 | |||
| 100% | 99.8% | 148,123 | 147,815 |
| 90% | 89.3% | 133,310 | 132,253 |
| 80% | 79.4% | 118,498 | 117,600 |
| 70% | 70.4% | 103,686 | 104,250 |
| 60% | 59.0% | 88,874 | 87,378 |
| 50% | 50.0% | 74,061 | 74,009 |
| 40% | 40.4% | 59,249 | 59,812 |
| 30% | 29.9% | 44,437 | 44,278 |
| 20% | 20.1% | 29,625 | 29,844 |
| 10% | 9.8% | 14,812 | 14,566 |
| Active Idle | 0 | 0 | |
| Target Load | Actual Load | ssj_ops | |
|---|---|---|---|
| Target | Actual | ||
| Calibration 1 | 149,662 | ||
| Calibration 2 | 150,222 | ||
| Calibration 3 | 149,424 | ||
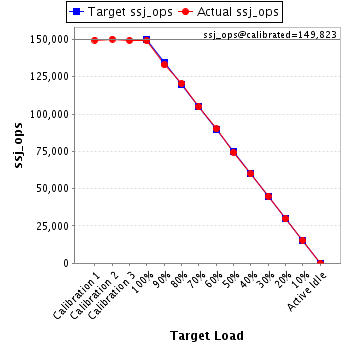
| ssj_ops@calibrated=149,823 | |||
| 100% | 99.6% | 149,823 | 149,232 |
| 90% | 88.8% | 134,840 | 133,001 |
| 80% | 80.4% | 119,858 | 120,476 |
| 70% | 70.0% | 104,876 | 104,844 |
| 60% | 60.2% | 89,894 | 90,128 |
| 50% | 49.7% | 74,911 | 74,453 |
| 40% | 40.0% | 59,929 | 59,855 |
| 30% | 30.1% | 44,947 | 45,026 |
| 20% | 19.9% | 29,965 | 29,748 |
| 10% | 10.4% | 14,982 | 15,518 |
| Active Idle | 0 | 0 | |