SPECpower_ssj2008
Host 'WIN-XPV7M4WY386' Performance Report
Copyright © 2007-2011 Standard Performance Evaluation Corporation
| Hitachi, Ltd. BS320 Server Blade C51P5 | ssj_ops@100% = 928,354 ssj_ops@100% per JVM = 154,726 |
||||
| Test Sponsor: | Hitachi, Ltd. | SPEC License #: | 35 | Test Method: | Multi Node |
| Tested By: | Hitachi, Ltd. | Test Location: | Hadano, Kanagawa, Japan | Test Date: | Feb 8, 2011 |
| Hardware Availability: | Feb-2011 | Software Availability: | Jun-2010 | Publication: | Feb 23, 2011 |
| System Source: | Single Supplier | System Designation: | Server | Power Provisioning: | Line-powered |
| Target Load | Actual Load | ssj_ops | |
|---|---|---|---|
| Target | Actual | ||
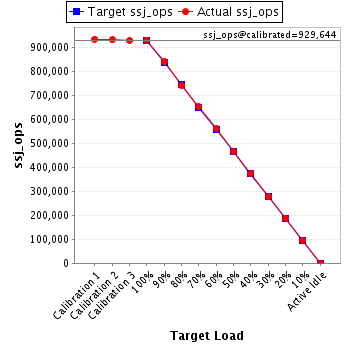
| Calibration 1 | 933,557 | ||
| Calibration 2 | 930,794 | ||
| Calibration 3 | 928,494 | ||
| ssj_ops@calibrated=929,644 | |||
| 100% | 99.9% | 929,644 | 928,354 |
| 90% | 90.2% | 836,679 | 838,667 |
| 80% | 79.7% | 743,715 | 741,109 |
| 70% | 70.1% | 650,751 | 651,744 |
| 60% | 60.2% | 557,786 | 559,530 |
| 50% | 50.2% | 464,822 | 466,270 |
| 40% | 40.1% | 371,857 | 372,489 |
| 30% | 29.8% | 278,893 | 277,359 |
| 20% | 20.1% | 185,929 | 186,750 |
| 10% | 10.1% | 92,964 | 94,094 |
| Active Idle | 0 | 0 | |
| Set Identifier: | sut |
| Set Description: | System Under Test |
| # of Identical Nodes: | 10 |
| Comment: | None |
| Hardware | |
|---|---|
| Hardware Vendor: | Hitachi, Ltd. |
| Model: | BS320 Server Blade C51P5 |
| Form Factor: | Blade |
| CPU Name: | Intel Xeon X5675 |
| CPU Characteristics: | Six Core, 3.06GHz, 12MB L3 Cache |
| CPU Frequency (MHz): | 3067 |
| CPU(s) Enabled: | 12 cores, 2 chips, 6 cores/chip |
| Hardware Threads: | 24 (2 / core) |
| CPU(s) Orderable: | 1,2 chips |
| Primary Cache: | 32 KB I + 32 KB D on chip per core |
| Secondary Cache: | 256 KB I+D on chip per core |
| Tertiary Cache: | 12 MB I+D on chip per chip |
| Other Cache: | None |
| Memory Amount (GB): | 24 |
| # and size of DIMM: | 6 x 4096 MB |
| Memory Details: | 4GB 2Rx4 PC3L-10600R ECC CL9 ; slots Memory0,1,2,3,4, and 5 populated |
| Power Supply Quantity and Rating (W): | None |
| Power Supply Details: | Shared |
| Disk Drive: | 1 x 32GB SSD SATA (Hitachi P/N: GG-UH9N32DN1EX) |
| Disk Controller: | Integrated SAS controller |
| # and type of Network Interface Cards (NICs) Installed: | 2 x Intel 82575EB Gigabit Network Connection (onboard) |
| NICs Enabled in Firmware / OS / Connected: | 2/1/1 |
| Network Speed (Mbit): | 1000 |
| Keyboard: | None |
| Mouse: | None |
| Monitor: | None |
| Optical Drives: | No |
| Other Hardware: | None |
| Software | |
|---|---|
| Power Management: | Enabled (Power saver) |
| Operating System (OS): | Microsoft Windows Server 2008 R2 Enterprise |
| OS Version: | R2 |
| Filesystem: | NTFS |
| JVM Vendor: | IBM Corporation |
| JVM Version: | IBM J9 VM (build 2.4, JRE 1.6.0 IBM J9 2.4 Windows Server 2008 amd64-64 jvmwa6460sr7-20100219_54049)(JIT enabled, AOT enabled) |
| JVM Command-line Options: | -Xaggressive -Xcompressedrefs -Xgcpolicy:gencon -Xmn1500 -Xms1875m -Xmx1875m -XlockReservation -Xnoloa -XtlhPrefetch -Xlp |
| JVM Affinity: | start /affinity [F,F0,F00,F000,F0000,F00000] |
| JVM Instances: | 6 |
| JVM Initial Heap (MB): | 1875 |
| JVM Maximum Heap (MB): | 1875 |
| JVM Address Bits: | 64 |
| Boot Firmware Version: | G15 |
| Management Firmware Version: | 01-51 |
| Workload Version: | SSJ 1.2.6 |
| Director Location: | Controller |
| Other Software: | IBM WebSphere Application Server V7.0 for Windows on x86-64 bit |
| JVM Instance | ssj_ops@100% |
|---|---|
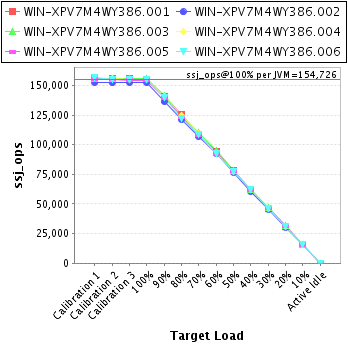
| WIN-XPV7M4WY386.001 | 155,338 |
| WIN-XPV7M4WY386.002 | 152,395 |
| WIN-XPV7M4WY386.003 | 155,572 |
| WIN-XPV7M4WY386.004 | 155,315 |
| WIN-XPV7M4WY386.005 | 154,507 |
| WIN-XPV7M4WY386.006 | 155,228 |
| ssj_ops@100% | 928,354 |
| ssj_ops@100% per JVM | 154,726 |
| Target Load | Actual Load | ssj_ops | |
|---|---|---|---|
| Target | Actual | ||
| Calibration 1 | 155,841 | ||
| Calibration 2 | 156,036 | ||
| Calibration 3 | 155,521 | ||
| ssj_ops@calibrated=155,779 | |||
| 100% | 99.7% | 155,779 | 155,338 |
| 90% | 90.1% | 140,201 | 140,405 |
| 80% | 80.5% | 124,623 | 125,400 |
| 70% | 69.5% | 109,045 | 108,228 |
| 60% | 60.5% | 93,467 | 94,177 |
| 50% | 50.2% | 77,889 | 78,271 |
| 40% | 40.0% | 62,311 | 62,292 |
| 30% | 29.6% | 46,734 | 46,131 |
| 20% | 19.9% | 31,156 | 31,021 |
| 10% | 10.1% | 15,578 | 15,691 |
| Active Idle | 0 | 0 | |

| Target Load | Actual Load | ssj_ops | |
|---|---|---|---|
| Target | Actual | ||
| Calibration 1 | 152,432 | ||
| Calibration 2 | 152,072 | ||
| Calibration 3 | 152,499 | ||
| ssj_ops@calibrated=152,286 | |||
| 100% | 100.1% | 152,286 | 152,395 |
| 90% | 89.6% | 137,057 | 136,377 |
| 80% | 79.5% | 121,829 | 121,119 |
| 70% | 70.3% | 106,600 | 107,058 |
| 60% | 60.6% | 91,371 | 92,325 |
| 50% | 50.5% | 76,143 | 76,955 |
| 40% | 39.8% | 60,914 | 60,641 |
| 30% | 29.9% | 45,686 | 45,547 |
| 20% | 20.0% | 30,457 | 30,510 |
| 10% | 10.2% | 15,229 | 15,508 |
| Active Idle | 0 | 0 | |

| Target Load | Actual Load | ssj_ops | |
|---|---|---|---|
| Target | Actual | ||
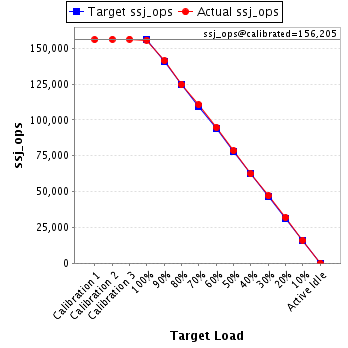
| Calibration 1 | 155,906 | ||
| Calibration 2 | 156,143 | ||
| Calibration 3 | 156,267 | ||
| ssj_ops@calibrated=156,205 | |||
| 100% | 99.6% | 156,205 | 155,572 |
| 90% | 90.4% | 140,584 | 141,246 |
| 80% | 79.7% | 124,964 | 124,562 |
| 70% | 70.8% | 109,343 | 110,533 |
| 60% | 60.7% | 93,723 | 94,797 |
| 50% | 50.2% | 78,102 | 78,449 |
| 40% | 39.9% | 62,482 | 62,287 |
| 30% | 30.1% | 46,861 | 46,971 |
| 20% | 20.4% | 31,241 | 31,907 |
| 10% | 10.3% | 15,620 | 16,027 |
| Active Idle | 0 | 0 | |
| Target Load | Actual Load | ssj_ops | |
|---|---|---|---|
| Target | Actual | ||
| Calibration 1 | 156,968 | ||
| Calibration 2 | 156,126 | ||
| Calibration 3 | 155,089 | ||
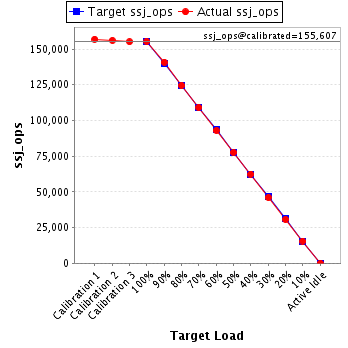
| ssj_ops@calibrated=155,607 | |||
| 100% | 99.8% | 155,607 | 155,315 |
| 90% | 90.5% | 140,047 | 140,859 |
| 80% | 80.0% | 124,486 | 124,536 |
| 70% | 70.1% | 108,925 | 109,125 |
| 60% | 59.7% | 93,364 | 92,960 |
| 50% | 50.0% | 77,804 | 77,770 |
| 40% | 40.2% | 62,243 | 62,483 |
| 30% | 29.6% | 46,682 | 45,982 |
| 20% | 19.7% | 31,121 | 30,691 |
| 10% | 10.0% | 15,561 | 15,577 |
| Active Idle | 0 | 0 | |
| Target Load | Actual Load | ssj_ops | |
|---|---|---|---|
| Target | Actual | ||
| Calibration 1 | 155,756 | ||
| Calibration 2 | 155,098 | ||
| Calibration 3 | 154,502 | ||
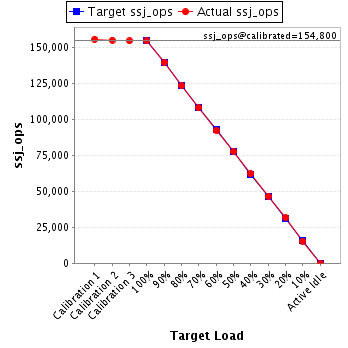
| ssj_ops@calibrated=154,800 | |||
| 100% | 99.8% | 154,800 | 154,507 |
| 90% | 90.3% | 139,320 | 139,732 |
| 80% | 79.7% | 123,840 | 123,432 |
| 70% | 69.8% | 108,360 | 108,018 |
| 60% | 59.6% | 92,880 | 92,314 |
| 50% | 50.2% | 77,400 | 77,660 |
| 40% | 40.2% | 61,920 | 62,207 |
| 30% | 30.1% | 46,440 | 46,571 |
| 20% | 20.5% | 30,960 | 31,659 |
| 10% | 10.0% | 15,480 | 15,458 |
| Active Idle | 0 | 0 | |
| Target Load | Actual Load | ssj_ops | |
|---|---|---|---|
| Target | Actual | ||
| Calibration 1 | 156,654 | ||
| Calibration 2 | 155,319 | ||
| Calibration 3 | 154,615 | ||
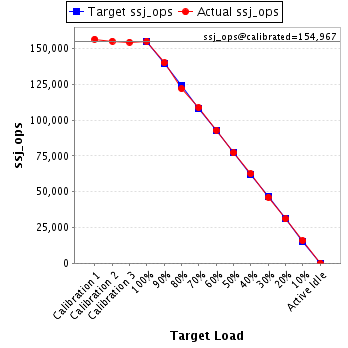
| ssj_ops@calibrated=154,967 | |||
| 100% | 100.2% | 154,967 | 155,228 |
| 90% | 90.4% | 139,471 | 140,049 |
| 80% | 78.8% | 123,974 | 122,060 |
| 70% | 70.2% | 108,477 | 108,781 |
| 60% | 60.0% | 92,980 | 92,958 |
| 50% | 49.8% | 77,484 | 77,164 |
| 40% | 40.4% | 61,987 | 62,579 |
| 30% | 29.8% | 46,490 | 46,156 |
| 20% | 20.0% | 30,993 | 30,962 |
| 10% | 10.2% | 15,497 | 15,832 |
| Active Idle | 0 | 0 | |