SPECpower_ssj2008
Host 'WIN-K4GNHJ9Z5JD' Performance Report
Copyright © 2007-2011 Standard Performance Evaluation Corporation
| Hitachi, Ltd. BS320 Server Blade C51P5 | ssj_ops@100% = 923,111 ssj_ops@100% per JVM = 153,852 |
||||
| Test Sponsor: | Hitachi, Ltd. | SPEC License #: | 35 | Test Method: | Multi Node |
| Tested By: | Hitachi, Ltd. | Test Location: | Hadano, Kanagawa, Japan | Test Date: | Feb 8, 2011 |
| Hardware Availability: | Feb-2011 | Software Availability: | Jun-2010 | Publication: | Feb 23, 2011 |
| System Source: | Single Supplier | System Designation: | Server | Power Provisioning: | Line-powered |
| Target Load | Actual Load | ssj_ops | |
|---|---|---|---|
| Target | Actual | ||
| Calibration 1 | 929,756 | ||
| Calibration 2 | 928,604 | ||
| Calibration 3 | 923,899 | ||
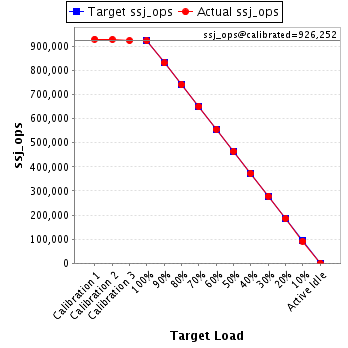
| ssj_ops@calibrated=926,252 | |||
| 100% | 99.7% | 926,252 | 923,111 |
| 90% | 89.7% | 833,627 | 830,915 |
| 80% | 80.0% | 741,001 | 740,569 |
| 70% | 70.2% | 648,376 | 650,370 |
| 60% | 60.0% | 555,751 | 556,134 |
| 50% | 50.2% | 463,126 | 464,653 |
| 40% | 40.2% | 370,501 | 372,414 |
| 30% | 30.1% | 277,876 | 278,540 |
| 20% | 20.0% | 185,250 | 185,465 |
| 10% | 9.9% | 92,625 | 91,500 |
| Active Idle | 0 | 0 | |
| Set Identifier: | sut |
| Set Description: | System Under Test |
| # of Identical Nodes: | 10 |
| Comment: | None |
| Hardware | |
|---|---|
| Hardware Vendor: | Hitachi, Ltd. |
| Model: | BS320 Server Blade C51P5 |
| Form Factor: | Blade |
| CPU Name: | Intel Xeon X5675 |
| CPU Characteristics: | Six Core, 3.06GHz, 12MB L3 Cache |
| CPU Frequency (MHz): | 3067 |
| CPU(s) Enabled: | 12 cores, 2 chips, 6 cores/chip |
| Hardware Threads: | 24 (2 / core) |
| CPU(s) Orderable: | 1,2 chips |
| Primary Cache: | 32 KB I + 32 KB D on chip per core |
| Secondary Cache: | 256 KB I+D on chip per core |
| Tertiary Cache: | 12 MB I+D on chip per chip |
| Other Cache: | None |
| Memory Amount (GB): | 24 |
| # and size of DIMM: | 6 x 4096 MB |
| Memory Details: | 4GB 2Rx4 PC3L-10600R ECC CL9 ; slots Memory0,1,2,3,4, and 5 populated |
| Power Supply Quantity and Rating (W): | None |
| Power Supply Details: | Shared |
| Disk Drive: | 1 x 32GB SSD SATA (Hitachi P/N: GG-UH9N32DN1EX) |
| Disk Controller: | Integrated SAS controller |
| # and type of Network Interface Cards (NICs) Installed: | 2 x Intel 82575EB Gigabit Network Connection (onboard) |
| NICs Enabled in Firmware / OS / Connected: | 2/1/1 |
| Network Speed (Mbit): | 1000 |
| Keyboard: | None |
| Mouse: | None |
| Monitor: | None |
| Optical Drives: | No |
| Other Hardware: | None |
| Software | |
|---|---|
| Power Management: | Enabled (Power saver) |
| Operating System (OS): | Microsoft Windows Server 2008 R2 Enterprise |
| OS Version: | R2 |
| Filesystem: | NTFS |
| JVM Vendor: | IBM Corporation |
| JVM Version: | IBM J9 VM (build 2.4, JRE 1.6.0 IBM J9 2.4 Windows Server 2008 amd64-64 jvmwa6460sr7-20100219_54049)(JIT enabled, AOT enabled) |
| JVM Command-line Options: | -Xaggressive -Xcompressedrefs -Xgcpolicy:gencon -Xmn1500 -Xms1875m -Xmx1875m -XlockReservation -Xnoloa -XtlhPrefetch -Xlp |
| JVM Affinity: | start /affinity [F,F0,F00,F000,F0000,F00000] |
| JVM Instances: | 6 |
| JVM Initial Heap (MB): | 1875 |
| JVM Maximum Heap (MB): | 1875 |
| JVM Address Bits: | 64 |
| Boot Firmware Version: | G15 |
| Management Firmware Version: | 01-51 |
| Workload Version: | SSJ 1.2.6 |
| Director Location: | Controller |
| Other Software: | IBM WebSphere Application Server V7.0 for Windows on x86-64 bit |
| JVM Instance | ssj_ops@100% |
|---|---|
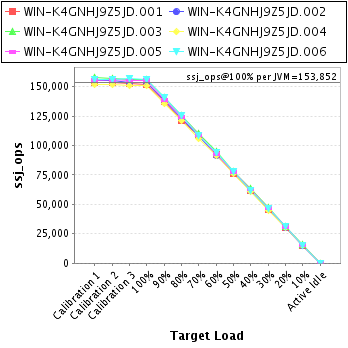
| WIN-K4GNHJ9Z5JD.001 | 151,943 |
| WIN-K4GNHJ9Z5JD.002 | 153,618 |
| WIN-K4GNHJ9Z5JD.003 | 155,885 |
| WIN-K4GNHJ9Z5JD.004 | 150,609 |
| WIN-K4GNHJ9Z5JD.005 | 155,421 |
| WIN-K4GNHJ9Z5JD.006 | 155,635 |
| ssj_ops@100% | 923,111 |
| ssj_ops@100% per JVM | 153,852 |
| Target Load | Actual Load | ssj_ops | |
|---|---|---|---|
| Target | Actual | ||
| Calibration 1 | 153,377 | ||
| Calibration 2 | 153,492 | ||
| Calibration 3 | 152,243 | ||
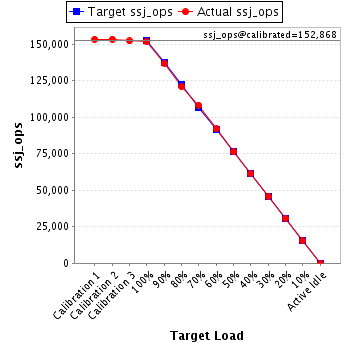
| ssj_ops@calibrated=152,868 | |||
| 100% | 99.4% | 152,868 | 151,943 |
| 90% | 89.7% | 137,581 | 137,097 |
| 80% | 79.0% | 122,294 | 120,842 |
| 70% | 70.8% | 107,007 | 108,243 |
| 60% | 60.2% | 91,721 | 91,986 |
| 50% | 49.9% | 76,434 | 76,327 |
| 40% | 40.2% | 61,147 | 61,499 |
| 30% | 30.0% | 45,860 | 45,875 |
| 20% | 20.1% | 30,574 | 30,656 |
| 10% | 10.0% | 15,287 | 15,272 |
| Active Idle | 0 | 0 | |
| Target Load | Actual Load | ssj_ops | |
|---|---|---|---|
| Target | Actual | ||
| Calibration 1 | 154,755 | ||
| Calibration 2 | 155,088 | ||
| Calibration 3 | 153,311 | ||
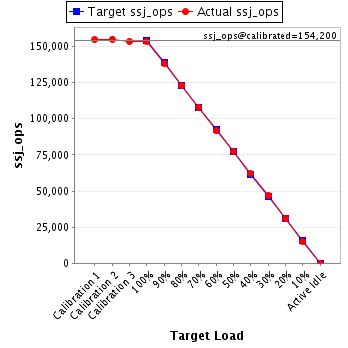
| ssj_ops@calibrated=154,200 | |||
| 100% | 99.6% | 154,200 | 153,618 |
| 90% | 89.6% | 138,780 | 138,223 |
| 80% | 79.7% | 123,360 | 122,934 |
| 70% | 70.1% | 107,940 | 108,122 |
| 60% | 59.4% | 92,520 | 91,640 |
| 50% | 50.3% | 77,100 | 77,617 |
| 40% | 40.2% | 61,680 | 61,992 |
| 30% | 30.4% | 46,260 | 46,852 |
| 20% | 19.9% | 30,840 | 30,732 |
| 10% | 9.8% | 15,420 | 15,108 |
| Active Idle | 0 | 0 | |
| Target Load | Actual Load | ssj_ops | |
|---|---|---|---|
| Target | Actual | ||
| Calibration 1 | 157,963 | ||
| Calibration 2 | 156,650 | ||
| Calibration 3 | 156,118 | ||
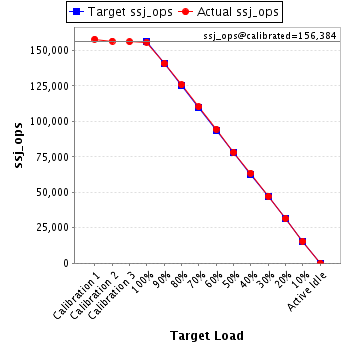
| ssj_ops@calibrated=156,384 | |||
| 100% | 99.7% | 156,384 | 155,885 |
| 90% | 90.1% | 140,746 | 140,837 |
| 80% | 80.5% | 125,107 | 125,844 |
| 70% | 70.5% | 109,469 | 110,310 |
| 60% | 60.4% | 93,831 | 94,529 |
| 50% | 50.1% | 78,192 | 78,321 |
| 40% | 40.6% | 62,554 | 63,524 |
| 30% | 30.2% | 46,915 | 47,198 |
| 20% | 20.2% | 31,277 | 31,512 |
| 10% | 9.9% | 15,638 | 15,550 |
| Active Idle | 0 | 0 | |
| Target Load | Actual Load | ssj_ops | |
|---|---|---|---|
| Target | Actual | ||
| Calibration 1 | 151,839 | ||
| Calibration 2 | 151,658 | ||
| Calibration 3 | 150,689 | ||
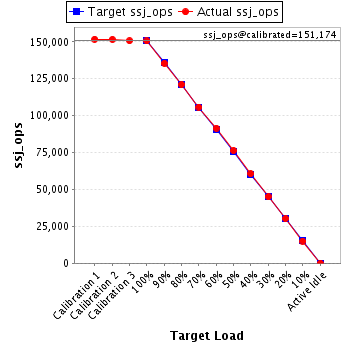
| ssj_ops@calibrated=151,174 | |||
| 100% | 99.6% | 151,174 | 150,609 |
| 90% | 89.6% | 136,056 | 135,406 |
| 80% | 80.1% | 120,939 | 121,062 |
| 70% | 70.0% | 105,822 | 105,861 |
| 60% | 60.5% | 90,704 | 91,525 |
| 50% | 50.5% | 75,587 | 76,410 |
| 40% | 40.1% | 60,469 | 60,657 |
| 30% | 29.8% | 45,352 | 45,052 |
| 20% | 20.0% | 30,235 | 30,230 |
| 10% | 10.0% | 15,117 | 15,083 |
| Active Idle | 0 | 0 | |
| Target Load | Actual Load | ssj_ops | |
|---|---|---|---|
| Target | Actual | ||
| Calibration 1 | 155,455 | ||
| Calibration 2 | 155,720 | ||
| Calibration 3 | 155,024 | ||
| ssj_ops@calibrated=155,372 | |||
| 100% | 100.0% | 155,372 | 155,421 |
| 90% | 89.4% | 139,835 | 138,948 |
| 80% | 80.0% | 124,298 | 124,312 |
| 70% | 70.2% | 108,760 | 109,103 |
| 60% | 59.5% | 93,223 | 92,448 |
| 50% | 50.1% | 77,686 | 77,867 |
| 40% | 40.4% | 62,149 | 62,797 |
| 30% | 30.1% | 46,612 | 46,708 |
| 20% | 19.9% | 31,074 | 30,952 |
| 10% | 9.7% | 15,537 | 15,097 |
| Active Idle | 0 | 0 | |

| Target Load | Actual Load | ssj_ops | |
|---|---|---|---|
| Target | Actual | ||
| Calibration 1 | 156,368 | ||
| Calibration 2 | 155,996 | ||
| Calibration 3 | 156,513 | ||
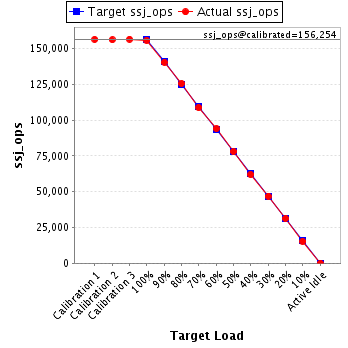
| ssj_ops@calibrated=156,254 | |||
| 100% | 99.6% | 156,254 | 155,635 |
| 90% | 89.9% | 140,629 | 140,403 |
| 80% | 80.4% | 125,003 | 125,575 |
| 70% | 69.6% | 109,378 | 108,731 |
| 60% | 60.2% | 93,753 | 94,006 |
| 50% | 50.0% | 78,127 | 78,110 |
| 40% | 39.6% | 62,502 | 61,945 |
| 30% | 30.0% | 46,876 | 46,855 |
| 20% | 20.1% | 31,251 | 31,383 |
| 10% | 9.9% | 15,625 | 15,391 |
| Active Idle | 0 | 0 | |