SPECpower_ssj2008
Host 'WIN-IRRKSMSAYI0' Performance Report
Copyright © 2007-2011 Standard Performance Evaluation Corporation
| Hitachi, Ltd. BS320 Server Blade C51P5 | ssj_ops@100% = 924,390 ssj_ops@100% per JVM = 154,065 |
||||
| Test Sponsor: | Hitachi, Ltd. | SPEC License #: | 35 | Test Method: | Multi Node |
| Tested By: | Hitachi, Ltd. | Test Location: | Hadano, Kanagawa, Japan | Test Date: | Feb 8, 2011 |
| Hardware Availability: | Feb-2011 | Software Availability: | Jun-2010 | Publication: | Feb 23, 2011 |
| System Source: | Single Supplier | System Designation: | Server | Power Provisioning: | Line-powered |
| Target Load | Actual Load | ssj_ops | |
|---|---|---|---|
| Target | Actual | ||
| Calibration 1 | 932,578 | ||
| Calibration 2 | 928,746 | ||
| Calibration 3 | 929,510 | ||
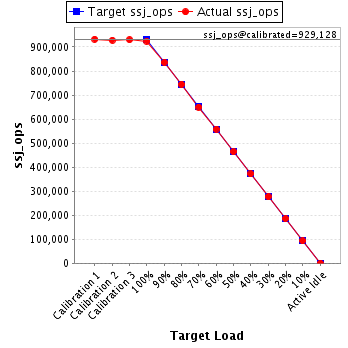
| ssj_ops@calibrated=929,128 | |||
| 100% | 99.5% | 929,128 | 924,390 |
| 90% | 90.0% | 836,215 | 836,390 |
| 80% | 80.2% | 743,302 | 745,219 |
| 70% | 70.0% | 650,390 | 650,170 |
| 60% | 60.1% | 557,477 | 558,689 |
| 50% | 49.9% | 464,564 | 463,977 |
| 40% | 40.0% | 371,651 | 371,587 |
| 30% | 29.8% | 278,738 | 276,783 |
| 20% | 20.0% | 185,826 | 185,935 |
| 10% | 10.0% | 92,913 | 93,128 |
| Active Idle | 0 | 0 | |
| Set Identifier: | sut |
| Set Description: | System Under Test |
| # of Identical Nodes: | 10 |
| Comment: | None |
| Hardware | |
|---|---|
| Hardware Vendor: | Hitachi, Ltd. |
| Model: | BS320 Server Blade C51P5 |
| Form Factor: | Blade |
| CPU Name: | Intel Xeon X5675 |
| CPU Characteristics: | Six Core, 3.06GHz, 12MB L3 Cache |
| CPU Frequency (MHz): | 3067 |
| CPU(s) Enabled: | 12 cores, 2 chips, 6 cores/chip |
| Hardware Threads: | 24 (2 / core) |
| CPU(s) Orderable: | 1,2 chips |
| Primary Cache: | 32 KB I + 32 KB D on chip per core |
| Secondary Cache: | 256 KB I+D on chip per core |
| Tertiary Cache: | 12 MB I+D on chip per chip |
| Other Cache: | None |
| Memory Amount (GB): | 24 |
| # and size of DIMM: | 6 x 4096 MB |
| Memory Details: | 4GB 2Rx4 PC3L-10600R ECC CL9 ; slots Memory0,1,2,3,4, and 5 populated |
| Power Supply Quantity and Rating (W): | None |
| Power Supply Details: | Shared |
| Disk Drive: | 1 x 32GB SSD SATA (Hitachi P/N: GG-UH9N32DN1EX) |
| Disk Controller: | Integrated SAS controller |
| # and type of Network Interface Cards (NICs) Installed: | 2 x Intel 82575EB Gigabit Network Connection (onboard) |
| NICs Enabled in Firmware / OS / Connected: | 2/1/1 |
| Network Speed (Mbit): | 1000 |
| Keyboard: | None |
| Mouse: | None |
| Monitor: | None |
| Optical Drives: | No |
| Other Hardware: | None |
| Software | |
|---|---|
| Power Management: | Enabled (Power saver) |
| Operating System (OS): | Microsoft Windows Server 2008 R2 Enterprise |
| OS Version: | R2 |
| Filesystem: | NTFS |
| JVM Vendor: | IBM Corporation |
| JVM Version: | IBM J9 VM (build 2.4, JRE 1.6.0 IBM J9 2.4 Windows Server 2008 amd64-64 jvmwa6460sr7-20100219_54049)(JIT enabled, AOT enabled) |
| JVM Command-line Options: | -Xaggressive -Xcompressedrefs -Xgcpolicy:gencon -Xmn1500 -Xms1875m -Xmx1875m -XlockReservation -Xnoloa -XtlhPrefetch -Xlp |
| JVM Affinity: | start /affinity [F,F0,F00,F000,F0000,F00000] |
| JVM Instances: | 6 |
| JVM Initial Heap (MB): | 1875 |
| JVM Maximum Heap (MB): | 1875 |
| JVM Address Bits: | 64 |
| Boot Firmware Version: | G15 |
| Management Firmware Version: | 01-51 |
| Workload Version: | SSJ 1.2.6 |
| Director Location: | Controller |
| Other Software: | IBM WebSphere Application Server V7.0 for Windows on x86-64 bit |
| JVM Instance | ssj_ops@100% |
|---|---|
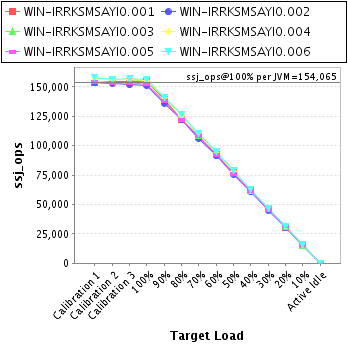
| WIN-IRRKSMSAYI0.001 | 154,383 |
| WIN-IRRKSMSAYI0.002 | 151,050 |
| WIN-IRRKSMSAYI0.003 | 154,956 |
| WIN-IRRKSMSAYI0.004 | 155,478 |
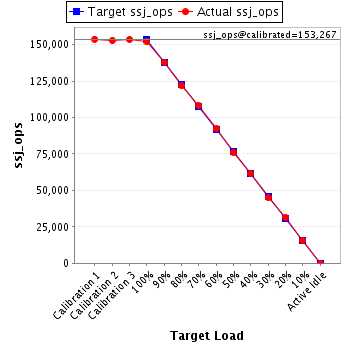
| WIN-IRRKSMSAYI0.005 | 152,073 |
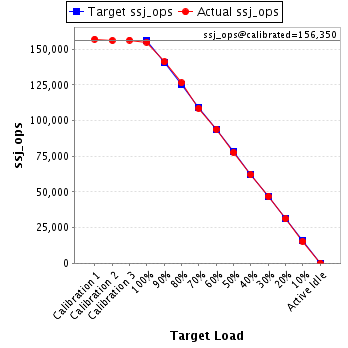
| WIN-IRRKSMSAYI0.006 | 156,450 |
| ssj_ops@100% | 924,390 |
| ssj_ops@100% per JVM | 154,065 |
| Target Load | Actual Load | ssj_ops | |
|---|---|---|---|
| Target | Actual | ||
| Calibration 1 | 153,972 | ||
| Calibration 2 | 154,305 | ||
| Calibration 3 | 154,430 | ||
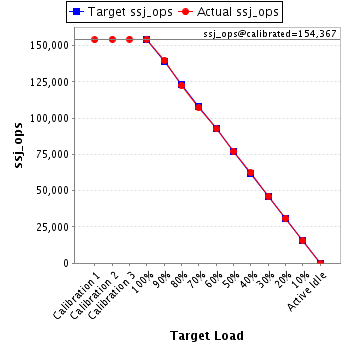
| ssj_ops@calibrated=154,367 | |||
| 100% | 100.0% | 154,367 | 154,383 |
| 90% | 90.4% | 138,931 | 139,602 |
| 80% | 79.3% | 123,494 | 122,445 |
| 70% | 69.6% | 108,057 | 107,446 |
| 60% | 60.0% | 92,620 | 92,596 |
| 50% | 50.0% | 77,184 | 77,212 |
| 40% | 40.3% | 61,747 | 62,266 |
| 30% | 30.0% | 46,310 | 46,312 |
| 20% | 19.9% | 30,873 | 30,767 |
| 10% | 10.1% | 15,437 | 15,529 |
| Active Idle | 0 | 0 | |
| Target Load | Actual Load | ssj_ops | |
|---|---|---|---|
| Target | Actual | ||
| Calibration 1 | 153,313 | ||
| Calibration 2 | 152,963 | ||
| Calibration 3 | 151,706 | ||
| ssj_ops@calibrated=152,335 | |||
| 100% | 99.2% | 152,335 | 151,050 |
| 90% | 89.3% | 137,101 | 136,057 |
| 80% | 80.1% | 121,868 | 122,026 |
| 70% | 69.6% | 106,634 | 106,038 |
| 60% | 59.9% | 91,401 | 91,296 |
| 50% | 49.8% | 76,167 | 75,880 |
| 40% | 39.8% | 60,934 | 60,630 |
| 30% | 29.6% | 45,700 | 45,158 |
| 20% | 20.1% | 30,467 | 30,620 |
| 10% | 10.0% | 15,233 | 15,245 |
| Active Idle | 0 | 0 | |

| Target Load | Actual Load | ssj_ops | |
|---|---|---|---|
| Target | Actual | ||
| Calibration 1 | 157,135 | ||
| Calibration 2 | 156,160 | ||
| Calibration 3 | 156,540 | ||
| ssj_ops@calibrated=156,350 | |||
| 100% | 99.1% | 156,350 | 154,956 |
| 90% | 90.3% | 140,715 | 141,179 |
| 80% | 80.9% | 125,080 | 126,445 |
| 70% | 69.5% | 109,445 | 108,682 |
| 60% | 60.1% | 93,810 | 93,999 |
| 50% | 49.8% | 78,175 | 77,795 |
| 40% | 39.7% | 62,540 | 62,014 |
| 30% | 30.0% | 46,905 | 46,886 |
| 20% | 19.9% | 31,270 | 31,102 |
| 10% | 9.8% | 15,635 | 15,372 |
| Active Idle | 0 | 0 | |
| Target Load | Actual Load | ssj_ops | |
|---|---|---|---|
| Target | Actual | ||
| Calibration 1 | 156,187 | ||
| Calibration 2 | 155,829 | ||
| Calibration 3 | 155,901 | ||
| ssj_ops@calibrated=155,865 | |||
| 100% | 99.8% | 155,865 | 155,478 |
| 90% | 90.4% | 140,279 | 140,904 |
| 80% | 80.8% | 124,692 | 125,863 |
| 70% | 70.0% | 109,106 | 109,088 |
| 60% | 60.0% | 93,519 | 93,452 |
| 50% | 50.0% | 77,933 | 77,933 |
| 40% | 40.0% | 62,346 | 62,283 |
| 30% | 29.8% | 46,760 | 46,522 |
| 20% | 20.0% | 31,173 | 31,199 |
| 10% | 10.0% | 15,587 | 15,658 |
| Active Idle | 0 | 0 | |

| Target Load | Actual Load | ssj_ops | |
|---|---|---|---|
| Target | Actual | ||
| Calibration 1 | 153,767 | ||
| Calibration 2 | 152,887 | ||
| Calibration 3 | 153,646 | ||
| ssj_ops@calibrated=153,267 | |||
| 100% | 99.2% | 153,267 | 152,073 |
| 90% | 89.9% | 137,940 | 137,786 |
| 80% | 79.6% | 122,613 | 121,984 |
| 70% | 70.6% | 107,287 | 108,167 |
| 60% | 60.3% | 91,960 | 92,420 |
| 50% | 49.7% | 76,633 | 76,161 |
| 40% | 40.1% | 61,307 | 61,484 |
| 30% | 29.3% | 45,980 | 44,925 |
| 20% | 20.4% | 30,653 | 31,331 |
| 10% | 10.2% | 15,327 | 15,641 |
| Active Idle | 0 | 0 | |
| Target Load | Actual Load | ssj_ops | |
|---|---|---|---|
| Target | Actual | ||
| Calibration 1 | 158,204 | ||
| Calibration 2 | 156,601 | ||
| Calibration 3 | 157,287 | ||
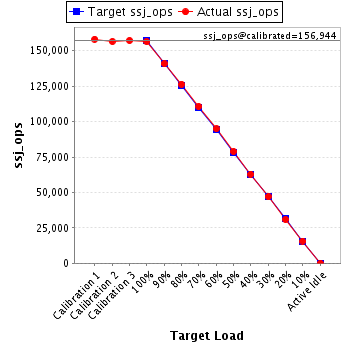
| ssj_ops@calibrated=156,944 | |||
| 100% | 99.7% | 156,944 | 156,450 |
| 90% | 89.8% | 141,249 | 140,863 |
| 80% | 80.6% | 125,555 | 126,456 |
| 70% | 70.6% | 109,861 | 110,749 |
| 60% | 60.5% | 94,166 | 94,926 |
| 50% | 50.3% | 78,472 | 78,995 |
| 40% | 40.1% | 62,778 | 62,910 |
| 30% | 29.9% | 47,083 | 46,981 |
| 20% | 19.7% | 31,389 | 30,916 |
| 10% | 10.0% | 15,694 | 15,683 |
| Active Idle | 0 | 0 | |