SPECpower_ssj2008
Host 'WIN-79T492G400U' Performance Report
Copyright © 2007-2011 Standard Performance Evaluation Corporation
| Hitachi, Ltd. BS320 Server Blade C51P5 | ssj_ops@100% = 925,308 ssj_ops@100% per JVM = 154,218 |
||||
| Test Sponsor: | Hitachi, Ltd. | SPEC License #: | 35 | Test Method: | Multi Node |
| Tested By: | Hitachi, Ltd. | Test Location: | Hadano, Kanagawa, Japan | Test Date: | Feb 8, 2011 |
| Hardware Availability: | Feb-2011 | Software Availability: | Jun-2010 | Publication: | Feb 23, 2011 |
| System Source: | Single Supplier | System Designation: | Server | Power Provisioning: | Line-powered |
| Target Load | Actual Load | ssj_ops | |
|---|---|---|---|
| Target | Actual | ||
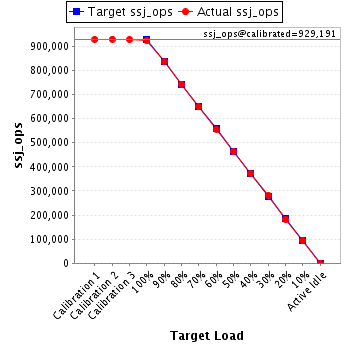
| Calibration 1 | 929,015 | ||
| Calibration 2 | 929,660 | ||
| Calibration 3 | 928,722 | ||
| ssj_ops@calibrated=929,191 | |||
| 100% | 99.6% | 929,191 | 925,308 |
| 90% | 89.9% | 836,272 | 835,423 |
| 80% | 80.0% | 743,353 | 743,397 |
| 70% | 69.9% | 650,434 | 649,809 |
| 60% | 59.9% | 557,514 | 556,329 |
| 50% | 49.9% | 464,595 | 463,798 |
| 40% | 40.0% | 371,676 | 371,759 |
| 30% | 30.3% | 278,757 | 281,120 |
| 20% | 19.8% | 185,838 | 183,561 |
| 10% | 10.0% | 92,919 | 93,076 |
| Active Idle | 0 | 0 | |
| Set Identifier: | sut |
| Set Description: | System Under Test |
| # of Identical Nodes: | 10 |
| Comment: | None |
| Hardware | |
|---|---|
| Hardware Vendor: | Hitachi, Ltd. |
| Model: | BS320 Server Blade C51P5 |
| Form Factor: | Blade |
| CPU Name: | Intel Xeon X5675 |
| CPU Characteristics: | Six Core, 3.06GHz, 12MB L3 Cache |
| CPU Frequency (MHz): | 3067 |
| CPU(s) Enabled: | 12 cores, 2 chips, 6 cores/chip |
| Hardware Threads: | 24 (2 / core) |
| CPU(s) Orderable: | 1,2 chips |
| Primary Cache: | 32 KB I + 32 KB D on chip per core |
| Secondary Cache: | 256 KB I+D on chip per core |
| Tertiary Cache: | 12 MB I+D on chip per chip |
| Other Cache: | None |
| Memory Amount (GB): | 24 |
| # and size of DIMM: | 6 x 4096 MB |
| Memory Details: | 4GB 2Rx4 PC3L-10600R ECC CL9 ; slots Memory0,1,2,3,4, and 5 populated |
| Power Supply Quantity and Rating (W): | None |
| Power Supply Details: | Shared |
| Disk Drive: | 1 x 32GB SSD SATA (Hitachi P/N: GG-UH9N32DN1EX) |
| Disk Controller: | Integrated SAS controller |
| # and type of Network Interface Cards (NICs) Installed: | 2 x Intel 82575EB Gigabit Network Connection (onboard) |
| NICs Enabled in Firmware / OS / Connected: | 2/1/1 |
| Network Speed (Mbit): | 1000 |
| Keyboard: | None |
| Mouse: | None |
| Monitor: | None |
| Optical Drives: | No |
| Other Hardware: | None |
| Software | |
|---|---|
| Power Management: | Enabled (Power saver) |
| Operating System (OS): | Microsoft Windows Server 2008 R2 Enterprise |
| OS Version: | R2 |
| Filesystem: | NTFS |
| JVM Vendor: | IBM Corporation |
| JVM Version: | IBM J9 VM (build 2.4, JRE 1.6.0 IBM J9 2.4 Windows Server 2008 amd64-64 jvmwa6460sr7-20100219_54049)(JIT enabled, AOT enabled) |
| JVM Command-line Options: | -Xaggressive -Xcompressedrefs -Xgcpolicy:gencon -Xmn1500 -Xms1875m -Xmx1875m -XlockReservation -Xnoloa -XtlhPrefetch -Xlp |
| JVM Affinity: | start /affinity [F,F0,F00,F000,F0000,F00000] |
| JVM Instances: | 6 |
| JVM Initial Heap (MB): | 1875 |
| JVM Maximum Heap (MB): | 1875 |
| JVM Address Bits: | 64 |
| Boot Firmware Version: | G15 |
| Management Firmware Version: | 01-51 |
| Workload Version: | SSJ 1.2.6 |
| Director Location: | Controller |
| Other Software: | IBM WebSphere Application Server V7.0 for Windows on x86-64 bit |
| JVM Instance | ssj_ops@100% |
|---|---|
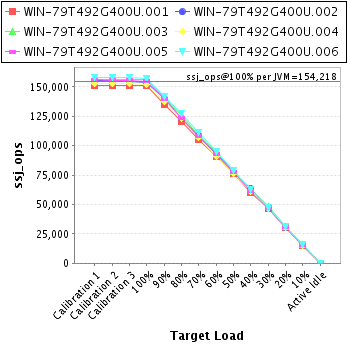
| WIN-79T492G400U.001 | 151,534 |
| WIN-79T492G400U.002 | 153,660 |
| WIN-79T492G400U.003 | 156,500 |
| WIN-79T492G400U.004 | 152,010 |
| WIN-79T492G400U.005 | 154,858 |
| WIN-79T492G400U.006 | 156,746 |
| ssj_ops@100% | 925,308 |
| ssj_ops@100% per JVM | 154,218 |
| Target Load | Actual Load | ssj_ops | |
|---|---|---|---|
| Target | Actual | ||
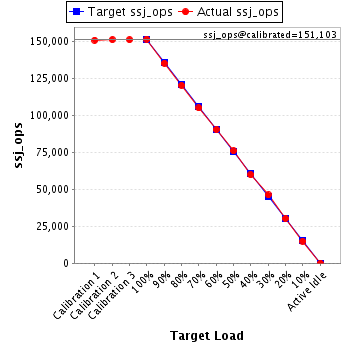
| Calibration 1 | 150,898 | ||
| Calibration 2 | 151,155 | ||
| Calibration 3 | 151,051 | ||
| ssj_ops@calibrated=151,103 | |||
| 100% | 100.3% | 151,103 | 151,534 |
| 90% | 89.5% | 135,993 | 135,262 |
| 80% | 79.6% | 120,883 | 120,306 |
| 70% | 69.5% | 105,772 | 105,011 |
| 60% | 59.9% | 90,662 | 90,492 |
| 50% | 50.3% | 75,552 | 75,953 |
| 40% | 39.6% | 60,441 | 59,800 |
| 30% | 30.6% | 45,331 | 46,186 |
| 20% | 20.1% | 30,221 | 30,310 |
| 10% | 9.9% | 15,110 | 14,983 |
| Active Idle | 0 | 0 | |
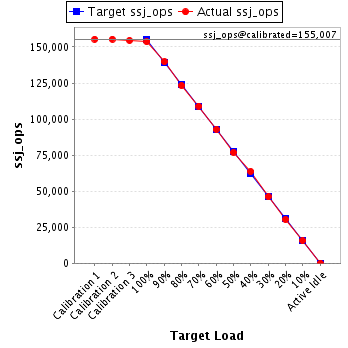
| Target Load | Actual Load | ssj_ops | |
|---|---|---|---|
| Target | Actual | ||
| Calibration 1 | 155,415 | ||
| Calibration 2 | 155,417 | ||
| Calibration 3 | 154,597 | ||
| ssj_ops@calibrated=155,007 | |||
| 100% | 99.1% | 155,007 | 153,660 |
| 90% | 90.2% | 139,506 | 139,780 |
| 80% | 79.5% | 124,006 | 123,179 |
| 70% | 70.3% | 108,505 | 108,964 |
| 60% | 59.9% | 93,004 | 92,917 |
| 50% | 49.6% | 77,504 | 76,894 |
| 40% | 41.1% | 62,003 | 63,700 |
| 30% | 29.8% | 46,502 | 46,163 |
| 20% | 19.6% | 31,001 | 30,367 |
| 10% | 10.2% | 15,501 | 15,737 |
| Active Idle | 0 | 0 | |
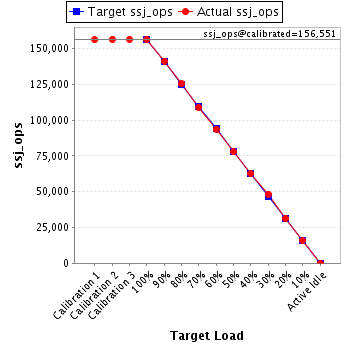
| Target Load | Actual Load | ssj_ops | |
|---|---|---|---|
| Target | Actual | ||
| Calibration 1 | 156,171 | ||
| Calibration 2 | 156,482 | ||
| Calibration 3 | 156,620 | ||
| ssj_ops@calibrated=156,551 | |||
| 100% | 100.0% | 156,551 | 156,500 |
| 90% | 90.2% | 140,896 | 141,186 |
| 80% | 80.1% | 125,241 | 125,343 |
| 70% | 69.7% | 109,586 | 109,047 |
| 60% | 59.9% | 93,931 | 93,827 |
| 50% | 49.8% | 78,276 | 77,888 |
| 40% | 40.0% | 62,621 | 62,598 |
| 30% | 30.9% | 46,965 | 48,367 |
| 20% | 20.0% | 31,310 | 31,299 |
| 10% | 10.2% | 15,655 | 15,991 |
| Active Idle | 0 | 0 | |
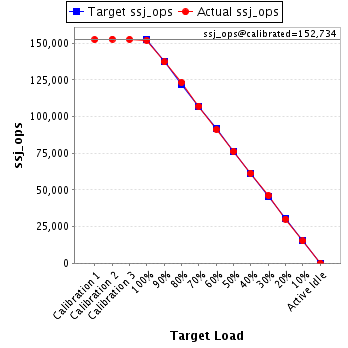
| Target Load | Actual Load | ssj_ops | |
|---|---|---|---|
| Target | Actual | ||
| Calibration 1 | 152,524 | ||
| Calibration 2 | 152,799 | ||
| Calibration 3 | 152,669 | ||
| ssj_ops@calibrated=152,734 | |||
| 100% | 99.5% | 152,734 | 152,010 |
| 90% | 89.9% | 137,461 | 137,233 |
| 80% | 80.7% | 122,187 | 123,282 |
| 70% | 70.1% | 106,914 | 107,130 |
| 60% | 59.7% | 91,640 | 91,176 |
| 50% | 49.9% | 76,367 | 76,253 |
| 40% | 40.1% | 61,094 | 61,291 |
| 30% | 30.2% | 45,820 | 46,177 |
| 20% | 19.7% | 30,547 | 30,149 |
| 10% | 10.0% | 15,273 | 15,213 |
| Active Idle | 0 | 0 | |
| Target Load | Actual Load | ssj_ops | |
|---|---|---|---|
| Target | Actual | ||
| Calibration 1 | 155,949 | ||
| Calibration 2 | 155,553 | ||
| Calibration 3 | 155,619 | ||
| ssj_ops@calibrated=155,586 | |||
| 100% | 99.5% | 155,586 | 154,858 |
| 90% | 90.0% | 140,028 | 140,032 |
| 80% | 79.4% | 124,469 | 123,542 |
| 70% | 69.5% | 108,910 | 108,197 |
| 60% | 59.9% | 93,352 | 93,174 |
| 50% | 49.9% | 77,793 | 77,652 |
| 40% | 39.4% | 62,235 | 61,285 |
| 30% | 30.1% | 46,676 | 46,836 |
| 20% | 19.6% | 31,117 | 30,464 |
| 10% | 9.8% | 15,559 | 15,309 |
| Active Idle | 0 | 0 | |

| Target Load | Actual Load | ssj_ops | |
|---|---|---|---|
| Target | Actual | ||
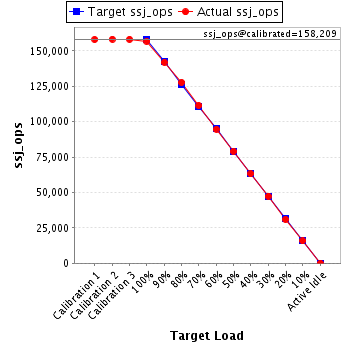
| Calibration 1 | 158,058 | ||
| Calibration 2 | 158,253 | ||
| Calibration 3 | 158,165 | ||
| ssj_ops@calibrated=158,209 | |||
| 100% | 99.1% | 158,209 | 156,746 |
| 90% | 89.7% | 142,388 | 141,931 |
| 80% | 80.7% | 126,567 | 127,745 |
| 70% | 70.5% | 110,746 | 111,459 |
| 60% | 59.9% | 94,925 | 94,742 |
| 50% | 50.0% | 79,104 | 79,158 |
| 40% | 39.9% | 63,284 | 63,084 |
| 30% | 30.0% | 47,463 | 47,391 |
| 20% | 19.6% | 31,642 | 30,970 |
| 10% | 10.0% | 15,821 | 15,841 |
| Active Idle | 0 | 0 | |