SPECpower_ssj2008
Host 'WIN-0XZPOTYEAFV' Performance Report
Copyright © 2007-2011 Standard Performance Evaluation Corporation
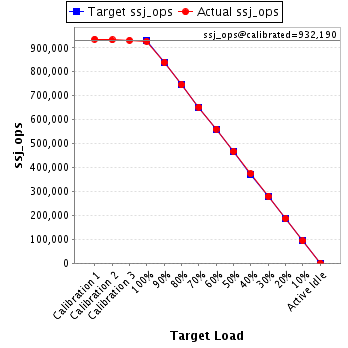
| Hitachi, Ltd. BS320 Server Blade C51P5 | ssj_ops@100% = 927,093 ssj_ops@100% per JVM = 154,515 |
||||
| Test Sponsor: | Hitachi, Ltd. | SPEC License #: | 35 | Test Method: | Multi Node |
| Tested By: | Hitachi, Ltd. | Test Location: | Hadano, Kanagawa, Japan | Test Date: | Feb 8, 2011 |
| Hardware Availability: | Feb-2011 | Software Availability: | Jun-2010 | Publication: | Feb 23, 2011 |
| System Source: | Single Supplier | System Designation: | Server | Power Provisioning: | Line-powered |
| Target Load | Actual Load | ssj_ops | |
|---|---|---|---|
| Target | Actual | ||
| Calibration 1 | 936,173 | ||
| Calibration 2 | 932,856 | ||
| Calibration 3 | 931,525 | ||
| ssj_ops@calibrated=932,190 | |||
| 100% | 99.5% | 932,190 | 927,093 |
| 90% | 90.0% | 838,971 | 839,246 |
| 80% | 79.9% | 745,752 | 745,154 |
| 70% | 70.0% | 652,533 | 652,173 |
| 60% | 60.2% | 559,314 | 560,738 |
| 50% | 50.1% | 466,095 | 467,176 |
| 40% | 40.1% | 372,876 | 373,866 |
| 30% | 30.0% | 279,657 | 279,325 |
| 20% | 20.0% | 186,438 | 186,833 |
| 10% | 10.0% | 93,219 | 93,423 |
| Active Idle | 0 | 0 | |
| Set Identifier: | sut |
| Set Description: | System Under Test |
| # of Identical Nodes: | 10 |
| Comment: | None |
| Hardware | |
|---|---|
| Hardware Vendor: | Hitachi, Ltd. |
| Model: | BS320 Server Blade C51P5 |
| Form Factor: | Blade |
| CPU Name: | Intel Xeon X5675 |
| CPU Characteristics: | Six Core, 3.06GHz, 12MB L3 Cache |
| CPU Frequency (MHz): | 3067 |
| CPU(s) Enabled: | 12 cores, 2 chips, 6 cores/chip |
| Hardware Threads: | 24 (2 / core) |
| CPU(s) Orderable: | 1,2 chips |
| Primary Cache: | 32 KB I + 32 KB D on chip per core |
| Secondary Cache: | 256 KB I+D on chip per core |
| Tertiary Cache: | 12 MB I+D on chip per chip |
| Other Cache: | None |
| Memory Amount (GB): | 24 |
| # and size of DIMM: | 6 x 4096 MB |
| Memory Details: | 4GB 2Rx4 PC3L-10600R ECC CL9 ; slots Memory0,1,2,3,4, and 5 populated |
| Power Supply Quantity and Rating (W): | None |
| Power Supply Details: | Shared |
| Disk Drive: | 1 x 32GB SSD SATA (Hitachi P/N: GG-UH9N32DN1EX) |
| Disk Controller: | Integrated SAS controller |
| # and type of Network Interface Cards (NICs) Installed: | 2 x Intel 82575EB Gigabit Network Connection (onboard) |
| NICs Enabled in Firmware / OS / Connected: | 2/1/1 |
| Network Speed (Mbit): | 1000 |
| Keyboard: | None |
| Mouse: | None |
| Monitor: | None |
| Optical Drives: | No |
| Other Hardware: | None |
| Software | |
|---|---|
| Power Management: | Enabled (Power saver) |
| Operating System (OS): | Microsoft Windows Server 2008 R2 Enterprise |
| OS Version: | R2 |
| Filesystem: | NTFS |
| JVM Vendor: | IBM Corporation |
| JVM Version: | IBM J9 VM (build 2.4, JRE 1.6.0 IBM J9 2.4 Windows Server 2008 amd64-64 jvmwa6460sr7-20100219_54049)(JIT enabled, AOT enabled) |
| JVM Command-line Options: | -Xaggressive -Xcompressedrefs -Xgcpolicy:gencon -Xmn1500 -Xms1875m -Xmx1875m -XlockReservation -Xnoloa -XtlhPrefetch -Xlp |
| JVM Affinity: | start /affinity [F,F0,F00,F000,F0000,F00000] |
| JVM Instances: | 6 |
| JVM Initial Heap (MB): | 1875 |
| JVM Maximum Heap (MB): | 1875 |
| JVM Address Bits: | 64 |
| Boot Firmware Version: | G15 |
| Management Firmware Version: | 01-51 |
| Workload Version: | SSJ 1.2.6 |
| Director Location: | Controller |
| Other Software: | IBM WebSphere Application Server V7.0 for Windows on x86-64 bit |
| JVM Instance | ssj_ops@100% |
|---|---|
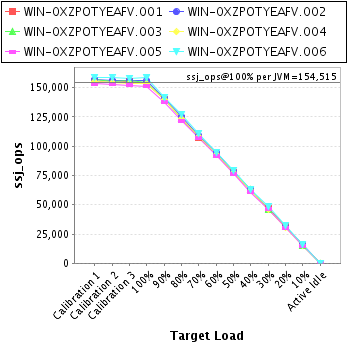
| WIN-0XZPOTYEAFV.001 | 153,852 |
| WIN-0XZPOTYEAFV.002 | 155,751 |
| WIN-0XZPOTYEAFV.003 | 154,501 |
| WIN-0XZPOTYEAFV.004 | 153,243 |
| WIN-0XZPOTYEAFV.005 | 151,433 |
| WIN-0XZPOTYEAFV.006 | 158,313 |
| ssj_ops@100% | 927,093 |
| ssj_ops@100% per JVM | 154,515 |
| Target Load | Actual Load | ssj_ops | |
|---|---|---|---|
| Target | Actual | ||
| Calibration 1 | 154,879 | ||
| Calibration 2 | 154,666 | ||
| Calibration 3 | 154,909 | ||
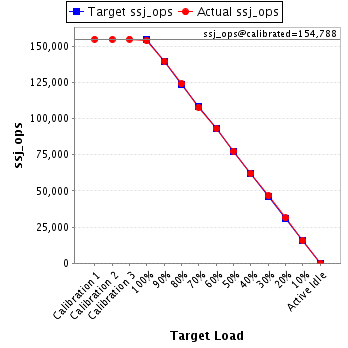
| ssj_ops@calibrated=154,788 | |||
| 100% | 99.4% | 154,788 | 153,852 |
| 90% | 90.3% | 139,309 | 139,788 |
| 80% | 80.1% | 123,830 | 123,972 |
| 70% | 69.7% | 108,352 | 107,839 |
| 60% | 60.2% | 92,873 | 93,174 |
| 50% | 50.1% | 77,394 | 77,549 |
| 40% | 40.1% | 61,915 | 62,035 |
| 30% | 30.1% | 46,436 | 46,544 |
| 20% | 20.2% | 30,958 | 31,330 |
| 10% | 10.1% | 15,479 | 15,663 |
| Active Idle | 0 | 0 | |
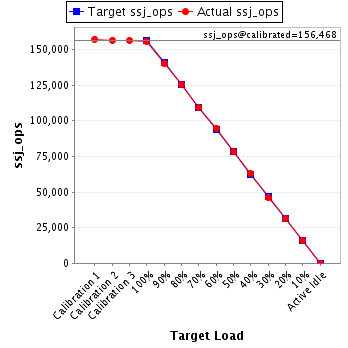
| Target Load | Actual Load | ssj_ops | |
|---|---|---|---|
| Target | Actual | ||
| Calibration 1 | 157,288 | ||
| Calibration 2 | 156,472 | ||
| Calibration 3 | 156,464 | ||
| ssj_ops@calibrated=156,468 | |||
| 100% | 99.5% | 156,468 | 155,751 |
| 90% | 89.7% | 140,821 | 140,376 |
| 80% | 80.0% | 125,174 | 125,193 |
| 70% | 69.9% | 109,527 | 109,299 |
| 60% | 60.6% | 93,881 | 94,887 |
| 50% | 50.1% | 78,234 | 78,413 |
| 40% | 40.3% | 62,587 | 63,074 |
| 30% | 29.4% | 46,940 | 46,057 |
| 20% | 19.9% | 31,294 | 31,091 |
| 10% | 10.2% | 15,647 | 15,937 |
| Active Idle | 0 | 0 | |
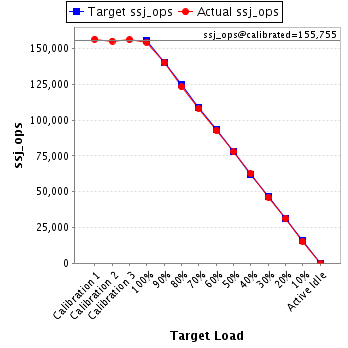
| Target Load | Actual Load | ssj_ops | |
|---|---|---|---|
| Target | Actual | ||
| Calibration 1 | 156,625 | ||
| Calibration 2 | 155,335 | ||
| Calibration 3 | 156,175 | ||
| ssj_ops@calibrated=155,755 | |||
| 100% | 99.2% | 155,755 | 154,501 |
| 90% | 89.9% | 140,179 | 140,043 |
| 80% | 79.1% | 124,604 | 123,267 |
| 70% | 69.6% | 109,028 | 108,383 |
| 60% | 59.6% | 93,453 | 92,905 |
| 50% | 50.0% | 77,877 | 77,865 |
| 40% | 40.2% | 62,302 | 62,594 |
| 30% | 29.7% | 46,726 | 46,252 |
| 20% | 19.9% | 31,151 | 31,041 |
| 10% | 9.8% | 15,575 | 15,213 |
| Active Idle | 0 | 0 | |
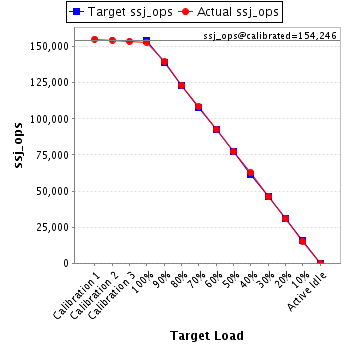
| Target Load | Actual Load | ssj_ops | |
|---|---|---|---|
| Target | Actual | ||
| Calibration 1 | 155,209 | ||
| Calibration 2 | 154,623 | ||
| Calibration 3 | 153,868 | ||
| ssj_ops@calibrated=154,246 | |||
| 100% | 99.3% | 154,246 | 153,243 |
| 90% | 90.6% | 138,821 | 139,682 |
| 80% | 80.0% | 123,397 | 123,411 |
| 70% | 70.4% | 107,972 | 108,596 |
| 60% | 60.3% | 92,547 | 92,985 |
| 50% | 50.2% | 77,123 | 77,364 |
| 40% | 40.6% | 61,698 | 62,579 |
| 30% | 29.9% | 46,274 | 46,094 |
| 20% | 19.9% | 30,849 | 30,675 |
| 10% | 9.9% | 15,425 | 15,311 |
| Active Idle | 0 | 0 | |
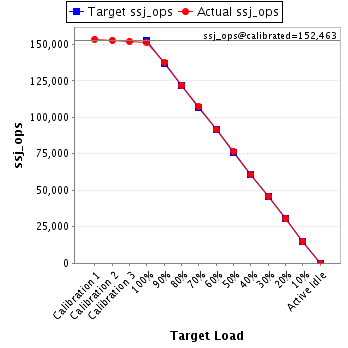
| Target Load | Actual Load | ssj_ops | |
|---|---|---|---|
| Target | Actual | ||
| Calibration 1 | 153,562 | ||
| Calibration 2 | 152,787 | ||
| Calibration 3 | 152,139 | ||
| ssj_ops@calibrated=152,463 | |||
| 100% | 99.3% | 152,463 | 151,433 |
| 90% | 90.3% | 137,217 | 137,663 |
| 80% | 80.0% | 121,970 | 121,934 |
| 70% | 70.3% | 106,724 | 107,201 |
| 60% | 60.2% | 91,478 | 91,732 |
| 50% | 50.3% | 76,231 | 76,646 |
| 40% | 39.7% | 60,985 | 60,535 |
| 30% | 30.2% | 45,739 | 46,049 |
| 20% | 19.9% | 30,493 | 30,351 |
| 10% | 9.9% | 15,246 | 15,150 |
| Active Idle | 0 | 0 | |
| Target Load | Actual Load | ssj_ops | |
|---|---|---|---|
| Target | Actual | ||
| Calibration 1 | 158,610 | ||
| Calibration 2 | 158,973 | ||
| Calibration 3 | 157,969 | ||
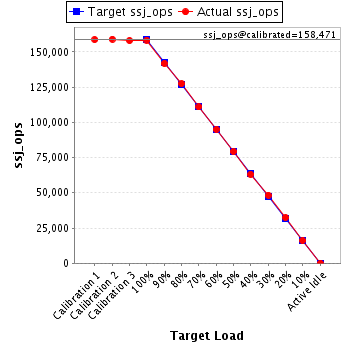
| ssj_ops@calibrated=158,471 | |||
| 100% | 99.9% | 158,471 | 158,313 |
| 90% | 89.4% | 142,624 | 141,693 |
| 80% | 80.4% | 126,777 | 127,377 |
| 70% | 70.0% | 110,930 | 110,856 |
| 60% | 60.0% | 95,083 | 95,054 |
| 50% | 50.1% | 79,236 | 79,341 |
| 40% | 39.8% | 63,388 | 63,050 |
| 30% | 30.5% | 47,541 | 48,330 |
| 20% | 20.4% | 31,694 | 32,346 |
| 10% | 10.2% | 15,847 | 16,148 |
| Active Idle | 0 | 0 | |